- Brazil
- /
- Auto Components
- /
- BOVESPA:PLAS3
Investors Still Aren't Entirely Convinced By Plascar Participações Industriais S.A.'s (BVMF:PLAS3) Revenues Despite 29% Price Jump


Plascar Participações Industriais S.A. (BVMF:PLAS3) shares have continued their recent momentum with a 29% gain in the last month alone. Unfortunately, despite the strong performance over the last month, the full year gain of 3.4% isn't as attractive.
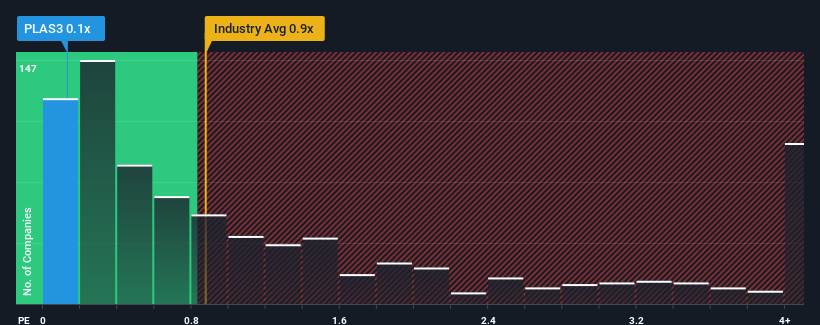
Even after such a large jump in price, Plascar Participações Industriais' price-to-sales (or "P/S") ratio of 0.1x might still make it look like a buy right now compared to the Auto Components industry in Brazil, where around half of the companies have P/S ratios above 0.9x and even P/S above 3x are quite common. Nonetheless, we'd need to dig a little deeper to determine if there is a rational basis for the reduced P/S.
See our latest analysis for Plascar Participações Industriais
What Does Plascar Participações Industriais' Recent Performance Look Like?
The revenue growth achieved at Plascar Participações Industriais over the last year would be more than acceptable for most companies. Perhaps the market is expecting this acceptable revenue performance to take a dive, which has kept the P/S suppressed. If you like the company, you'd be hoping this isn't the case so that you could potentially pick up some stock while it's out of favour.
Although there are no analyst estimates available for Plascar Participações Industriais, take a look at this free data-rich visualisation to see how the company stacks up on earnings, revenue and cash flow.Do Revenue Forecasts Match The Low P/S Ratio?
In order to justify its P/S ratio, Plascar Participações Industriais would need to produce sluggish growth that's trailing the industry.
Retrospectively, the last year delivered an exceptional 17% gain to the company's top line. The strong recent performance means it was also able to grow revenue by 162% in total over the last three years. Accordingly, shareholders would have definitely welcomed those medium-term rates of revenue growth.
When compared to the industry's one-year growth forecast of 9.1%, the most recent medium-term revenue trajectory is noticeably more alluring
In light of this, it's peculiar that Plascar Participações Industriais' P/S sits below the majority of other companies. It looks like most investors are not convinced the company can maintain its recent growth rates.
The Key Takeaway
The latest share price surge wasn't enough to lift Plascar Participações Industriais' P/S close to the industry median. It's argued the price-to-sales ratio is an inferior measure of value within certain industries, but it can be a powerful business sentiment indicator.
We're very surprised to see Plascar Participações Industriais currently trading on a much lower than expected P/S since its recent three-year growth is higher than the wider industry forecast. When we see robust revenue growth that outpaces the industry, we presume that there are notable underlying risks to the company's future performance, which is exerting downward pressure on the P/S ratio. While recent revenue trends over the past medium-term suggest that the risk of a price decline is low, investors appear to perceive a likelihood of revenue fluctuations in the future.
Before you settle on your opinion, we've discovered 4 warning signs for Plascar Participações Industriais (3 are concerning!) that you should be aware of.
If companies with solid past earnings growth is up your alley, you may wish to see this free collection of other companies with strong earnings growth and low P/E ratios.
If you're looking to trade Plascar Participações Industriais, open an account with the lowest-cost platform trusted by professionals, Interactive Brokers.
With clients in over 200 countries and territories, and access to 160 markets, IBKR lets you trade stocks, options, futures, forex, bonds and funds from a single integrated account.
Enjoy no hidden fees, no account minimums, and FX conversion rates as low as 0.03%, far better than what most brokers offer.
Sponsored ContentNew: Manage All Your Stock Portfolios in One Place
We've created the ultimate portfolio companion for stock investors, and it's free.
• Connect an unlimited number of Portfolios and see your total in one currency
• Be alerted to new Warning Signs or Risks via email or mobile
• Track the Fair Value of your stocks
Have feedback on this article? Concerned about the content? Get in touch with us directly. Alternatively, email editorial-team (at) simplywallst.com.
This article by Simply Wall St is general in nature. We provide commentary based on historical data and analyst forecasts only using an unbiased methodology and our articles are not intended to be financial advice. It does not constitute a recommendation to buy or sell any stock, and does not take account of your objectives, or your financial situation. We aim to bring you long-term focused analysis driven by fundamental data. Note that our analysis may not factor in the latest price-sensitive company announcements or qualitative material. Simply Wall St has no position in any stocks mentioned.
About BOVESPA:PLAS3
Plascar Participações Industriais
Through its subsidiary, manufactures and sells plastic pieces and parts related to interior and exterior finishing of motor vehicles in Brazil.
Slight and slightly overvalued.
Market Insights

Community Narratives


