- Belgium
- /
- Real Estate
- /
- ENXTBR:TEXF
European Dividend Stocks To Consider For Your Portfolio

Reviewed by Simply Wall St

As the pan-European STOXX Europe 600 Index continues its longest streak of weekly gains since August 2012, driven by encouraging company results and defense stock performance, investors are navigating a mixed economic landscape marked by varied inflation rates and economic contractions in major economies like Germany and France. In such an environment, dividend stocks can offer a degree of stability and income potential, making them an attractive consideration for those looking to balance growth with reliable returns amidst ongoing market uncertainties.
Top 10 Dividend Stocks In Europe
| Name | Dividend Yield | Dividend Rating |
| Zurich Insurance Group (SWX:ZURN) | 4.23% | ★★★★★★ |
| Julius Bär Gruppe (SWX:BAER) | 4.22% | ★★★★★★ |
| Mapfre (BME:MAP) | 5.82% | ★★★★★★ |
| Bredband2 i Skandinavien (OM:BRE2) | 4.84% | ★★★★★★ |
| Rubis (ENXTPA:RUI) | 7.49% | ★★★★★★ |
| Vaudoise Assurances Holding (SWX:VAHN) | 4.33% | ★★★★★★ |
| Cembra Money Bank (SWX:CMBN) | 4.36% | ★★★★★★ |
| Banque Cantonale Vaudoise (SWX:BCVN) | 4.53% | ★★★★★★ |
| Thermador Groupe (ENXTPA:THEP) | 3.17% | ★★★★★☆ |
| Telekom Austria (WBAG:TKA) | 4.69% | ★★★★★☆ |
Click here to see the full list of 221 stocks from our Top European Dividend Stocks screener.
Let's take a closer look at a couple of our picks from the screened companies.
RCS MediaGroup (BIT:RCS)
Simply Wall St Dividend Rating: ★★★★☆☆
Overview: RCS MediaGroup S.p.A. is engaged in providing multimedia publishing services both in Italy and internationally, with a market cap of €453.56 million.
Operations: RCS MediaGroup S.p.A. generates revenue through its segments of Magazines Italy (€65.20 million), Italy Newspapers (€371 million), Unidad Editorial (€220.60 million), and Advertising and Sport (€286.10 million).
Dividend Yield: 6.8%
RCS MediaGroup's dividend payments are well-supported by both earnings and cash flows, with a payout ratio of 58.6% and a cash payout ratio of 34.3%. Despite being in the top quartile for dividend yield in Italy, RCS has an unstable dividend track record with payments over six years marked by volatility and unreliability. The stock trades significantly below its estimated fair value, offering potential appeal to value-focused investors.
- Take a closer look at RCS MediaGroup's potential here in our dividend report.
- According our valuation report, there's an indication that RCS MediaGroup's share price might be on the cheaper side.
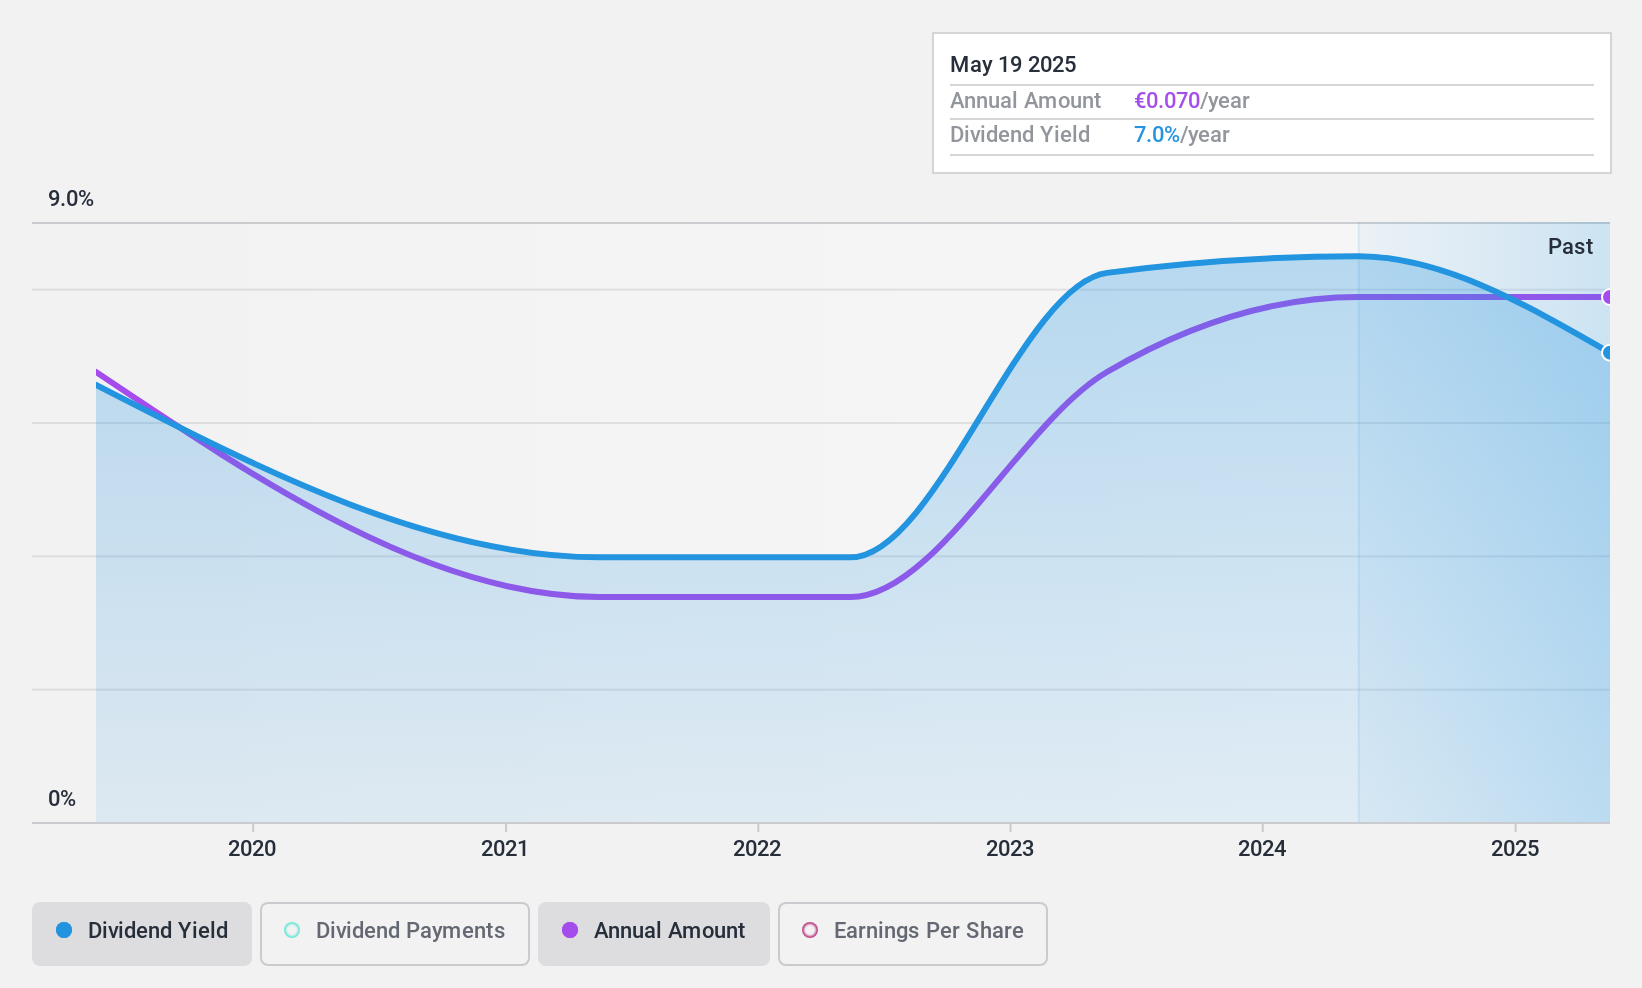
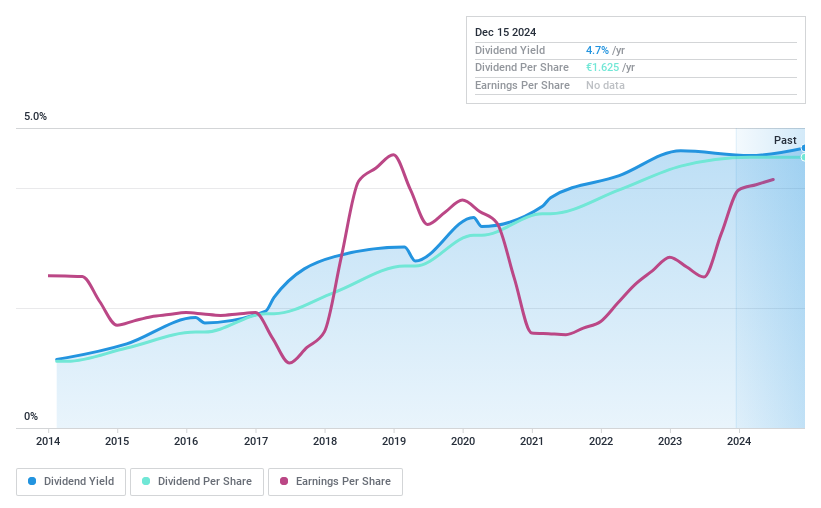
Texaf (ENXTBR:TEXF)
Simply Wall St Dividend Rating: ★★★★★☆
Overview: Texaf S.A. develops, owns, and leases real estate properties in Kinshasa with a market cap of €126.13 million.
Operations: Texaf S.A.'s revenue is primarily derived from its Real Estate segment (€24.26 million), supplemented by its Carrigres operations (€6.30 million) and a smaller contribution from Digital activities (€0.03 million).
Dividend Yield: 4.7%
Texaf offers a stable dividend yield of 4.72%, though it lags behind the top 25% in Belgium. The company has consistently increased its dividends over the past decade, supported by a payout ratio of 49.6% and cash flow coverage at 56.5%. Despite some large one-off items affecting earnings, Texaf's price-to-earnings ratio of 10.4x suggests potential value compared to the broader Belgian market average of 13.5x.
- Unlock comprehensive insights into our analysis of Texaf stock in this dividend report.
- The valuation report we've compiled suggests that Texaf's current price could be inflated.
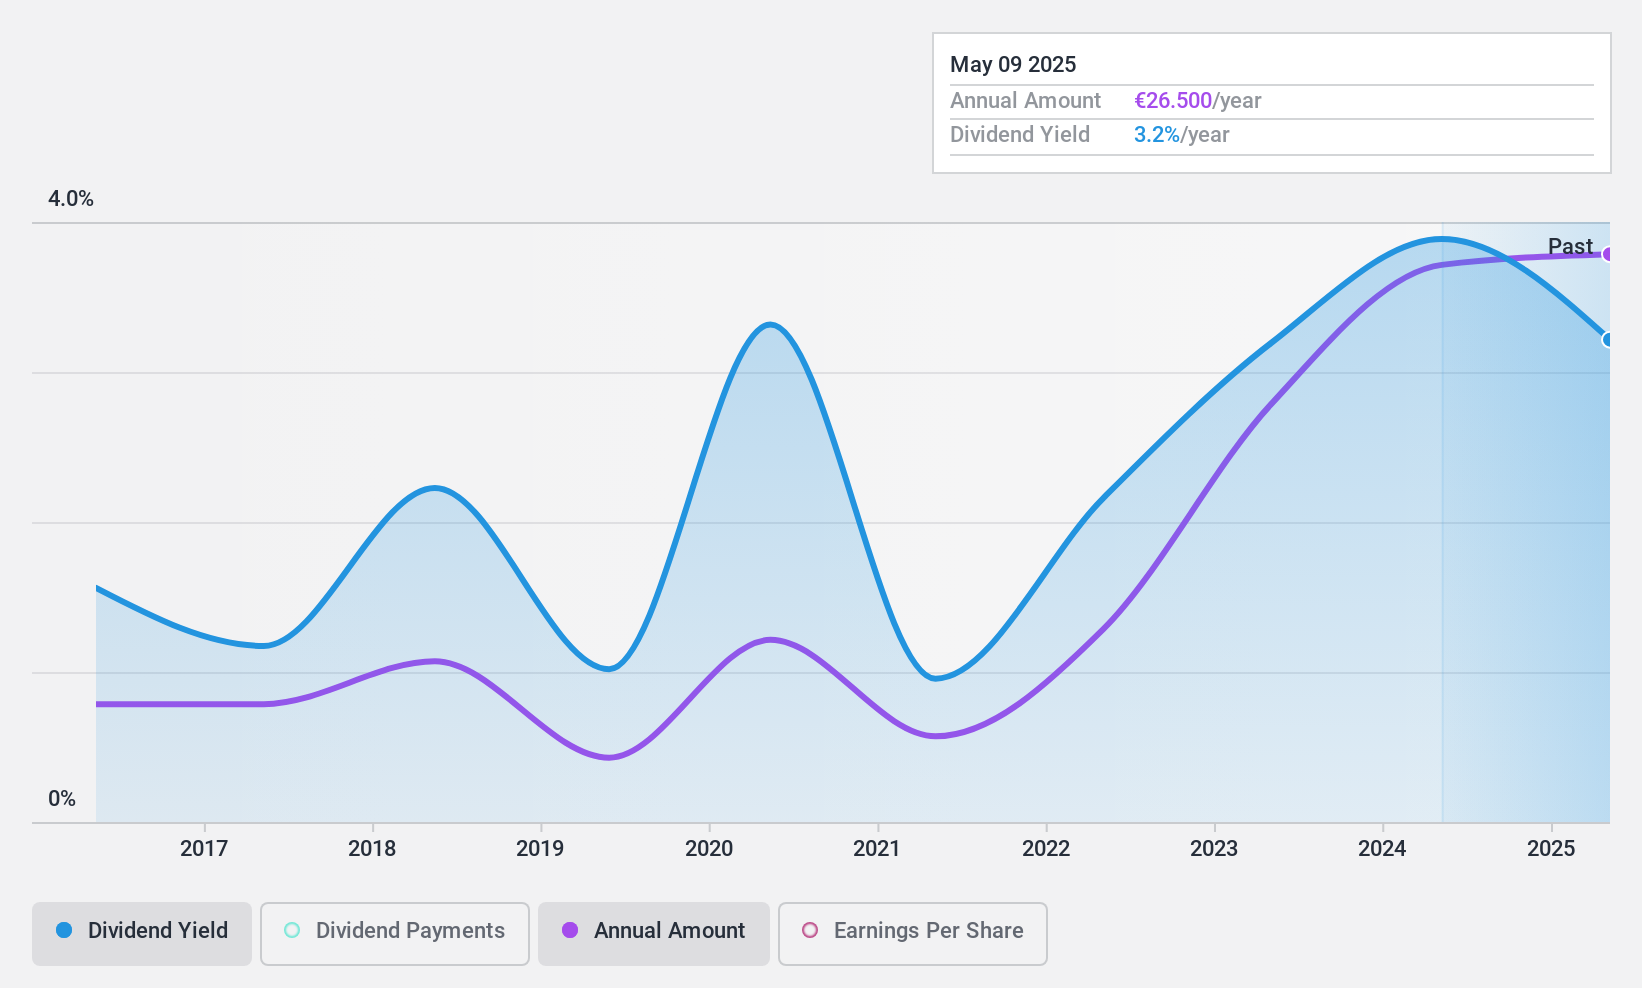
KSB SE KGaA (XTRA:KSB)
Simply Wall St Dividend Rating: ★★★★☆☆
Overview: KSB SE & Co. KGaA, along with its subsidiaries, manufactures and supplies pumps, valves, and related services globally, with a market capitalization of approximately €1.26 billion.
Operations: KSB SE & Co. KGaA generates revenue through its primary segments: Pumps (€1.52 billion), Fittings (€370.94 million), and KSB Supremeserv (€978.20 million).
Dividend Yield: 3.5%
KSB SE KGaA's dividend payments have grown over the past decade, yet remain volatile and lower than Germany's top 25% dividend payers. The dividends are well covered by both earnings and cash flows, with payout ratios of 29.9% and 24.2%, respectively. Despite large one-off items impacting earnings, the company trades at a significant discount to its estimated fair value, suggesting potential value for investors seeking growth alongside dividends. Recent guidance indicates strong EBIT expectations for 2024 between €210 million and €245 million.
- Delve into the full analysis dividend report here for a deeper understanding of KSB SE KGaA.
- Our valuation report unveils the possibility KSB SE KGaA's shares may be trading at a discount.
Make It Happen
- Get an in-depth perspective on all 221 Top European Dividend Stocks by using our screener here.
- Got skin in the game with these stocks? Elevate how you manage them by using Simply Wall St's portfolio, where intuitive tools await to help optimize your investment outcomes.
- Unlock the power of informed investing with Simply Wall St, your free guide to navigating stock markets worldwide.
Interested In Other Possibilities?
- Explore high-performing small cap companies that haven't yet garnered significant analyst attention.
- Fuel your portfolio with companies showing strong growth potential, backed by optimistic outlooks both from analysts and management.
- Find companies with promising cash flow potential yet trading below their fair value.
This article by Simply Wall St is general in nature. We provide commentary based on historical data and analyst forecasts only using an unbiased methodology and our articles are not intended to be financial advice. It does not constitute a recommendation to buy or sell any stock, and does not take account of your objectives, or your financial situation. We aim to bring you long-term focused analysis driven by fundamental data. Note that our analysis may not factor in the latest price-sensitive company announcements or qualitative material. Simply Wall St has no position in any stocks mentioned.
Valuation is complex, but we're here to simplify it.
Discover if Texaf might be undervalued or overvalued with our detailed analysis, featuring fair value estimates, potential risks, dividends, insider trades, and its financial condition.
Access Free AnalysisHave feedback on this article? Concerned about the content? Get in touch with us directly. Alternatively, email editorial-team@simplywallst.com
About ENXTBR:TEXF
Established dividend payer with adequate balance sheet.
Market Insights

Community Narratives
