
Advertisement
Could The Market Be Wrong About Umicore SA (EBR:UMI) Given Its Attractive Financial Prospects?
With its stock down 12% over the past three months, it is easy to disregard Umicore (EBR:UMI). However, a closer look at its sound financials might cause you to think again. Given that fundamentals usually drive long-term market outcomes, the company is worth looking at. Specifically, we decided to study Umicore's ROE in this article.
Return on equity or ROE is a key measure used to assess how efficiently a company's management is utilizing the company's capital. In other words, it is a profitability ratio which measures the rate of return on the capital provided by the company's shareholders.
See our latest analysis for Umicore
How Do You Calculate Return On Equity?
Return on equity can be calculated by using the formula:
Return on Equity = Net Profit (from continuing operations) ÷ Shareholders' Equity
So, based on the above formula, the ROE for Umicore is:
10% = €377m ÷ €3.7b (Based on the trailing twelve months to December 2023).
The 'return' is the yearly profit. So, this means that for every €1 of its shareholder's investments, the company generates a profit of €0.10.
What Is The Relationship Between ROE And Earnings Growth?
So far, we've learned that ROE is a measure of a company's profitability. Based on how much of its profits the company chooses to reinvest or "retain", we are then able to evaluate a company's future ability to generate profits. Assuming everything else remains unchanged, the higher the ROE and profit retention, the higher the growth rate of a company compared to companies that don't necessarily bear these characteristics.
Umicore's Earnings Growth And 10% ROE
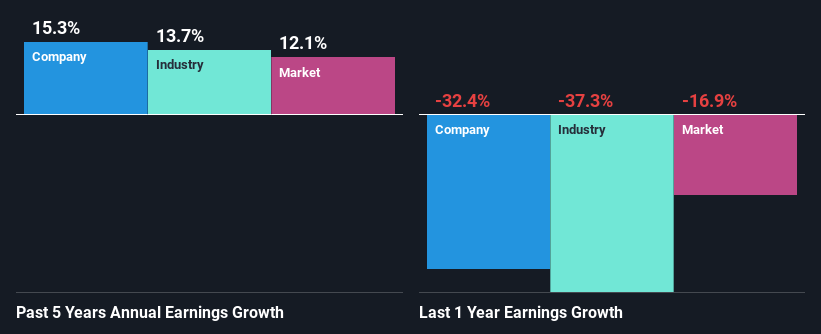
To begin with, Umicore seems to have a respectable ROE. Even when compared to the industry average of 10% the company's ROE looks quite decent. This probably goes some way in explaining Umicore's moderate 15% growth over the past five years amongst other factors.
Next, on comparing Umicore's net income growth with the industry, we found that the company's reported growth is similar to the industry average growth rate of 14% over the last few years.
Earnings growth is a huge factor in stock valuation. What investors need to determine next is if the expected earnings growth, or the lack of it, is already built into the share price. By doing so, they will have an idea if the stock is headed into clear blue waters or if swampy waters await. If you're wondering about Umicore's's valuation, check out this gauge of its price-to-earnings ratio, as compared to its industry.
Is Umicore Using Its Retained Earnings Effectively?
Umicore has a three-year median payout ratio of 36%, which implies that it retains the remaining 64% of its profits. This suggests that its dividend is well covered, and given the decent growth seen by the company, it looks like management is reinvesting its earnings efficiently.
Besides, Umicore has been paying dividends for at least ten years or more. This shows that the company is committed to sharing profits with its shareholders. Looking at the current analyst consensus data, we can see that the company's future payout ratio is expected to rise to 49% over the next three years. Regardless, the ROE is not expected to change much for the company despite the higher expected payout ratio.
Summary
In total, we are pretty happy with Umicore's performance. Particularly, we like that the company is reinvesting heavily into its business, and at a high rate of return. Unsurprisingly, this has led to an impressive earnings growth. That being so, a study of the latest analyst forecasts show that the company is expected to see a slowdown in its future earnings growth. To know more about the company's future earnings growth forecasts take a look at this free report on analyst forecasts for the company to find out more.
New: AI Stock Screener & Alerts
Our new AI Stock Screener scans the market every day to uncover opportunities.
• Dividend Powerhouses (3%+ Yield)
• Undervalued Small Caps with Insider Buying
• High growth Tech and AI Companies
Or build your own from over 50 metrics.
Have feedback on this article? Concerned about the content? Get in touch with us directly. Alternatively, email editorial-team (at) simplywallst.com.
This article by Simply Wall St is general in nature. We provide commentary based on historical data and analyst forecasts only using an unbiased methodology and our articles are not intended to be financial advice. It does not constitute a recommendation to buy or sell any stock, and does not take account of your objectives, or your financial situation. We aim to bring you long-term focused analysis driven by fundamental data. Note that our analysis may not factor in the latest price-sensitive company announcements or qualitative material. Simply Wall St has no position in any stocks mentioned.
About ENXTBR:UMI
Umicore
Operates as a materials technology and recycling company in Belgium, Europe, the Asia-Pacific, North America, South America, and Africa.
Slight risk with moderate growth potential.
Similar Companies
Market Insights


Advertisement
Community Narratives
The Next Phase of Defense AI: A Robotic Response to America’s Security Gaps
Fair Value US$12.00|49.7% undervalued
MA
Community Contributor
Figma (FIG): The S&P 500’s Design Standard Turning Into an All-in-One Platform
Fair Value US$65.70|7.0% overvalued
TI
Community Contributor
Sleep Cycle's Revenue Set to Rise 10% with Strong Revenue Model
Fair Value SEK 38.04|22.5% undervalued
MA
Community Contributor
Has JB Hi-Fi Lost Its Point of Difference?
Fair Value AU$76.00|52.5% overvalued
RO
Community Contributor