Advertisement
Does Tessenderlo Group’s 35% 2025 Rally Signal Room for Further Growth?

Simply Wall St
Reviewed by Simply Wall St
If you have been eyeing Tessenderlo Group stock and wondering whether to hold, buy, or move on, you are far from alone. The company’s share price sits at €26.00 after showing a modest 0.4% lift in the past week, though it dipped by 1.7% over the last month. Zoom out further, and you will notice a 35.1% surge since the start of the year, reflecting renewed optimism or shifts in perceived risk among investors. While the one-year return is up 7.8%, the longer-term picture includes a few challenges, with the stock still trailing its value from three and five years ago.
These swings are not happening in a vacuum. Broader market trends affecting European industrials and recent momentum in sustainable chemicals have cast Tessenderlo Group in a new light. Short-term dips can often be attributed to sector rotations or evolving views on companies with exposure to global supply chains. However, the sharp rise year-to-date signals that many investors see upside potential, or at the very least, believe risks may be overdone.
If you are trying to make sense of it all, looking at how undervalued the stock is might help. On a commonly used valuation scale, Tessenderlo Group scores a 4 out of 6, meaning it’s undervalued on four out of six key checks compared to its peers. But not all valuation methods are created equal. In the next section, I will break down the main ways analysts evaluate Tessenderlo Group’s worth before setting the stage for an even deeper and often more telling way to size up the company’s value.
Tessenderlo Group delivered 7.8% returns over the last year. See how this stacks up to the rest of the Chemicals industry.Approach 1: Tessenderlo Group Discounted Cash Flow (DCF) Analysis
The Discounted Cash Flow (DCF) model estimates a company’s value by projecting its future cash flows and discounting them back to their present value. This approach helps investors gauge what a business is fundamentally worth, based on what it is expected to earn over time rather than just current profits or market trends.
For Tessenderlo Group, the most recent Free Cash Flow (FCF) stands at €127.8 million. Analysts project moderate growth in future cash flows, with forecasts suggesting that by 2035 the company’s annual FCF could reach approximately €151.6 million. The projections show yearly growth rates typically between 1.4% and 1.9%, with a gradual increase each year based on underlying business and sector stability. While analysts typically provide estimates for the next five years, these further-out numbers are informed by Simply Wall St’s ongoing extrapolation models.
According to the DCF calculation, Tessenderlo Group’s estimated intrinsic value is €43.53 per share. Compared to the current share price of €26.00, this suggests the stock is trading at roughly a 40.3% discount. This indicates it is significantly undervalued on this measure.
Result: UNDERVALUED
Head to the Valuation section of our Company Report for more details on how we arrive at this Fair Value for Tessenderlo Group.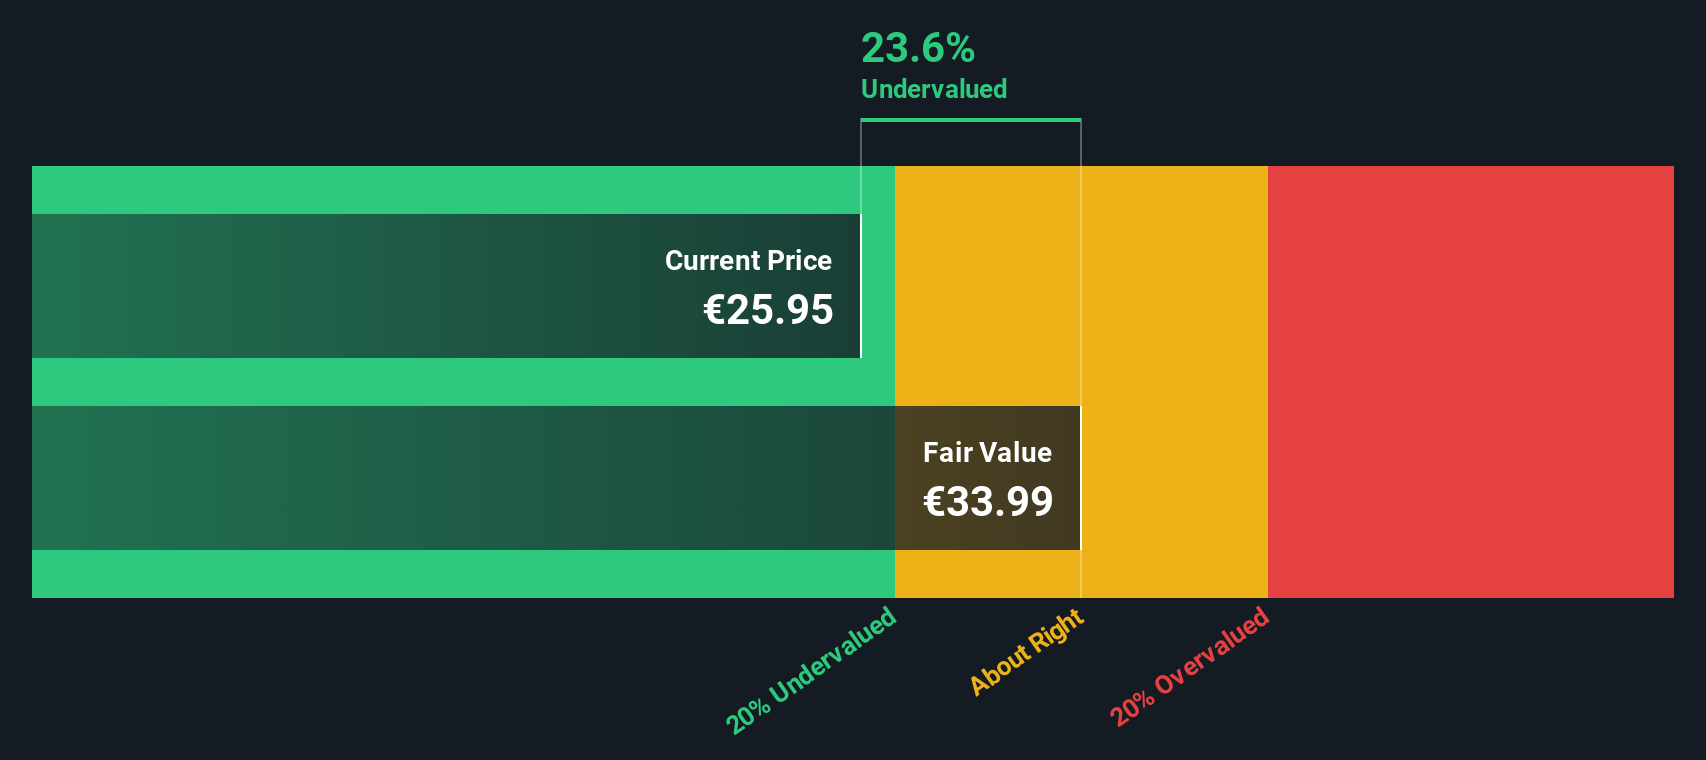
Approach 2: Tessenderlo Group Price vs Sales
For profitable companies like Tessenderlo Group, the Price-to-Sales (P/S) ratio is often a reliable valuation metric. It allows investors to gauge how much the market is willing to pay for each euro of the company’s sales. This is especially helpful when comparing businesses in sectors where profits can be cyclical or affected by accounting choices.
Growth expectations and risk play a significant role in what the market considers a “fair” P/S ratio. Higher growth companies typically command higher multiples, as investors are willing to pay more for the potential of future expansion. In contrast, higher-risk companies generally trade at lower valuations.
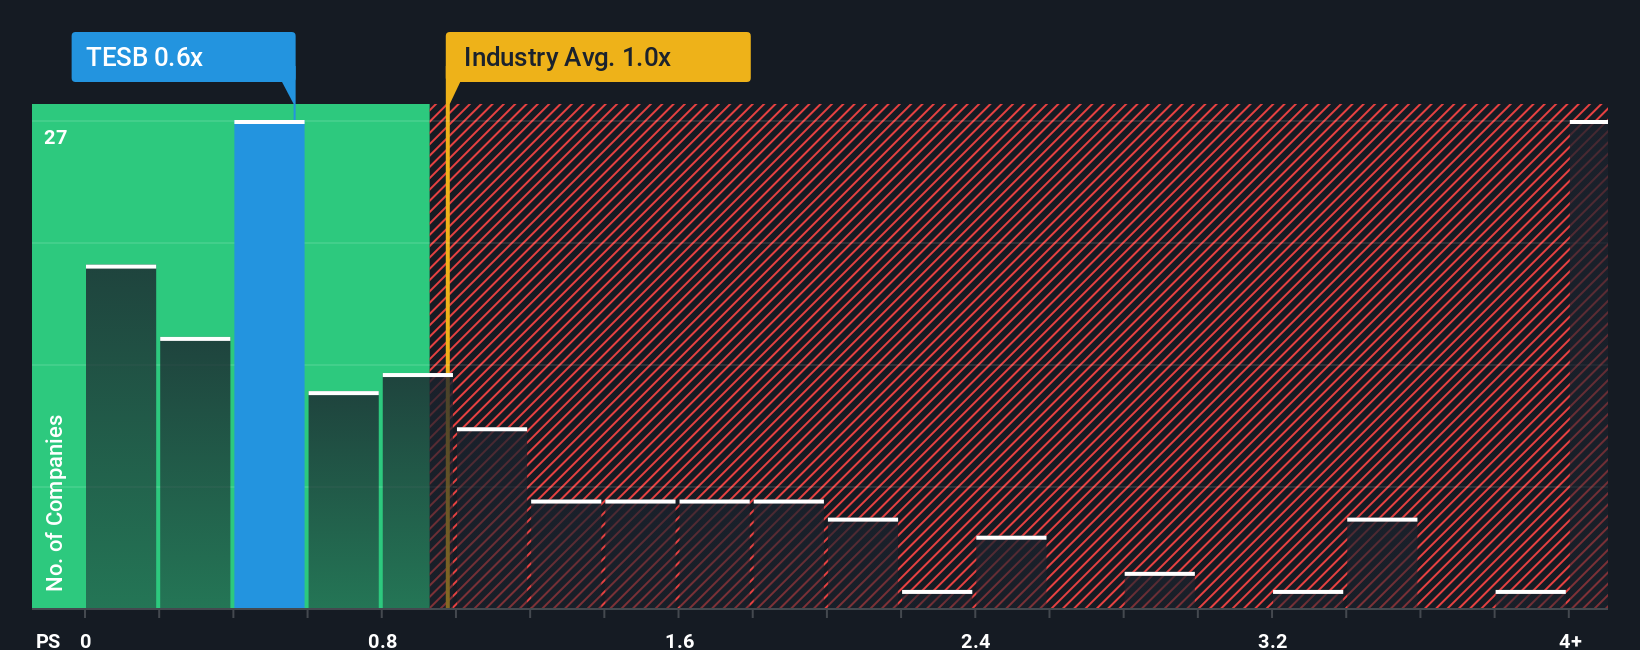
Currently, Tessenderlo Group’s P/S ratio sits at 0.56x. This is below the industry average for Chemicals companies of 1.39x and also below the peer average of 0.44x. However, it is important to consider more than just a raw comparison. Simply Wall St’s proprietary Fair Ratio for Tessenderlo comes in at 0.58x, which is calculated using a blend of company-specific factors such as growth outlook, risk, profitability, and market capitalization. This tailored benchmark offers a more nuanced reflection of what the company’s true valuation should be, compared to a one-size-fits-all comparison.
Because Tessenderlo’s actual P/S ratio is very close to its Fair Ratio, the stock appears to be appropriately valued on this measure.
Result: ABOUT RIGHT
Upgrade Your Decision Making: Choose your Tessenderlo Group Narrative
Earlier we mentioned that there's an even better way to understand valuation, so let's introduce you to Narratives. A Narrative is your personal story about Tessenderlo Group’s future, where you connect the company’s business outlook and market changes to your own assumptions about things like fair value, future revenue, earnings, and margins. By building a Narrative, you move beyond just looking at the latest numbers and give context to the forecasts, linking what’s happening in the real world to financial models and ultimately, to what you think the shares are truly worth.
On Simply Wall St’s Community page, Narratives are easy to use and update automatically as new news or financials are announced, so your investment logic always stays current. Narratives help you decide when to buy or sell by comparing your own fair value calculation with where the company’s price is now. This allows you to see if others share your outlook or spot where opinions diverge. For example, one Tessenderlo Group Narrative, focused on strong expansion and higher margins, might estimate fair value at €28.33 per share. A more cautious Narrative highlights margin risk and sees lower fair value. Your assumptions drive the investment view.
Do you think there's more to the story for Tessenderlo Group? Create your own Narrative to let the Community know!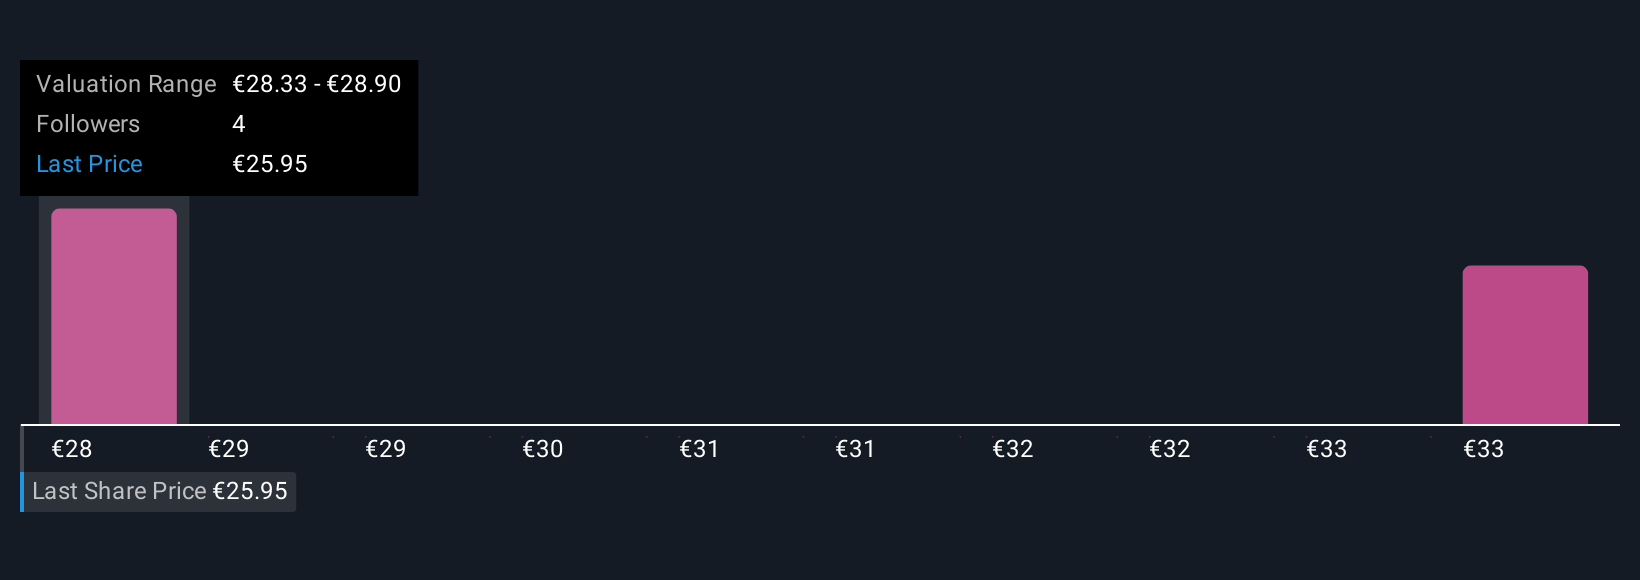
This article by Simply Wall St is general in nature. We provide commentary based on historical data and analyst forecasts only using an unbiased methodology and our articles are not intended to be financial advice. It does not constitute a recommendation to buy or sell any stock, and does not take account of your objectives, or your financial situation. We aim to bring you long-term focused analysis driven by fundamental data. Note that our analysis may not factor in the latest price-sensitive company announcements or qualitative material. Simply Wall St has no position in any stocks mentioned.
Valuation is complex, but we're here to simplify it.
Discover if Tessenderlo Group might be undervalued or overvalued with our detailed analysis, featuring fair value estimates, potential risks, dividends, insider trades, and its financial condition.
Access Free AnalysisHave feedback on this article? Concerned about the content? Get in touch with us directly. Alternatively, email editorial-team@simplywallst.com
About ENXTBR:TESB
Tessenderlo Group
Engages in the agriculture, valorizing bio-residuals, machinery, mechanical engineering, electronics, energy, and industrial solution businesses worldwide.
Flawless balance sheet and fair value.
Similar Companies
Market Insights

Advertisement
Community Narratives
Finding The True Value Of A Logistics Powerhouse
Fair Value US$95.21|8.4% undervalued
NV
Community Contributor
Paradigm Biopharmaceuticals Will Lead Osteoarthritis Treatment with Zilosul's FDA Success
Fair Value AU$5.50|91.9% undervalued
AM
Community Contributor
Barrick Mining (ABX:CA): A Gold Hedge against a U.S. Shutdown
Fair Value CA$60.00|24.2% undervalued
GM
Community Contributor