- Belgium
- /
- Electrical
- /
- ENXTBR:CENER
Here's Why Cenergy Holdings (EBR:CENER) Is Weighed Down By Its Debt Load

David Iben put it well when he said, 'Volatility is not a risk we care about. What we care about is avoiding the permanent loss of capital.' It's only natural to consider a company's balance sheet when you examine how risky it is, since debt is often involved when a business collapses. We note that Cenergy Holdings SA (EBR:CENER) does have debt on its balance sheet. But the more important question is: how much risk is that debt creating?
When Is Debt A Problem?
Debt and other liabilities become risky for a business when it cannot easily fulfill those obligations, either with free cash flow or by raising capital at an attractive price. In the worst case scenario, a company can go bankrupt if it cannot pay its creditors. While that is not too common, we often do see indebted companies permanently diluting shareholders because lenders force them to raise capital at a distressed price. Of course, plenty of companies use debt to fund growth, without any negative consequences. The first step when considering a company's debt levels is to consider its cash and debt together.
See our latest analysis for Cenergy Holdings
How Much Debt Does Cenergy Holdings Carry?
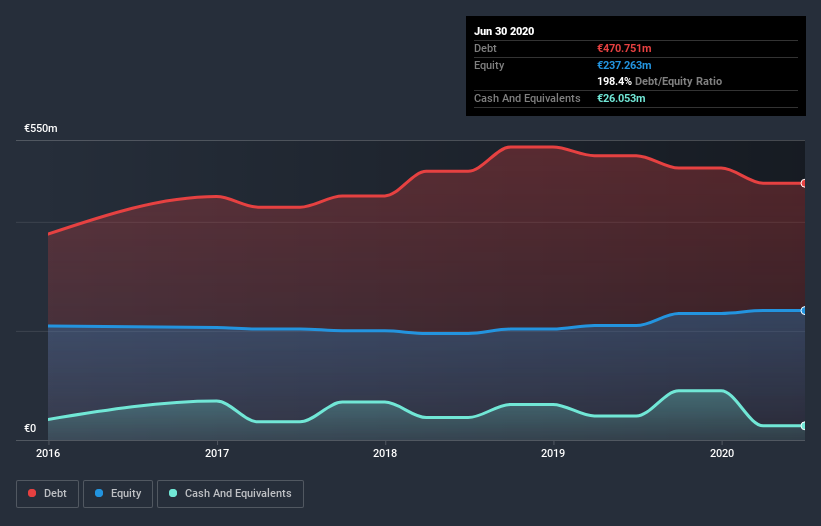
As you can see below, Cenergy Holdings had €470.8m of debt at June 2020, down from €521.1m a year prior. However, it does have €26.1m in cash offsetting this, leading to net debt of about €444.7m.

How Healthy Is Cenergy Holdings's Balance Sheet?
We can see from the most recent balance sheet that Cenergy Holdings had liabilities of €548.7m falling due within a year, and liabilities of €216.6m due beyond that. Offsetting these obligations, it had cash of €26.1m as well as receivables valued at €240.2m due within 12 months. So its liabilities outweigh the sum of its cash and (near-term) receivables by €499.0m.
When you consider that this deficiency exceeds the company's €332.8m market capitalization, you might well be inclined to review the balance sheet intently. Hypothetically, extremely heavy dilution would be required if the company were forced to pay down its liabilities by raising capital at the current share price.
We measure a company's debt load relative to its earnings power by looking at its net debt divided by its earnings before interest, tax, depreciation, and amortization (EBITDA) and by calculating how easily its earnings before interest and tax (EBIT) cover its interest expense (interest cover). Thus we consider debt relative to earnings both with and without depreciation and amortization expenses.
Cenergy Holdings shareholders face the double whammy of a high net debt to EBITDA ratio (5.2), and fairly weak interest coverage, since EBIT is just 1.9 times the interest expense. The debt burden here is substantial. The good news is that Cenergy Holdings grew its EBIT a smooth 38% over the last twelve months. Like a mother's loving embrace of a newborn that sort of growth builds resilience, putting the company in a stronger position to manage its debt. When analysing debt levels, the balance sheet is the obvious place to start. But it is Cenergy Holdings's earnings that will influence how the balance sheet holds up in the future. So when considering debt, it's definitely worth looking at the earnings trend. Click here for an interactive snapshot.
Finally, while the tax-man may adore accounting profits, lenders only accept cold hard cash. So the logical step is to look at the proportion of that EBIT that is matched by actual free cash flow. Over the last three years, Cenergy Holdings saw substantial negative free cash flow, in total. While that may be a result of expenditure for growth, it does make the debt far more risky.
Our View
To be frank both Cenergy Holdings's level of total liabilities and its track record of converting EBIT to free cash flow make us rather uncomfortable with its debt levels. But at least it's pretty decent at growing its EBIT; that's encouraging. Overall, it seems to us that Cenergy Holdings's balance sheet is really quite a risk to the business. For this reason we're pretty cautious about the stock, and we think shareholders should keep a close eye on its liquidity. There's no doubt that we learn most about debt from the balance sheet. However, not all investment risk resides within the balance sheet - far from it. To that end, you should learn about the 2 warning signs we've spotted with Cenergy Holdings (including 1 which is is significant) .
At the end of the day, it's often better to focus on companies that are free from net debt. You can access our special list of such companies (all with a track record of profit growth). It's free.
If you decide to trade Cenergy Holdings, use the lowest-cost* platform that is rated #1 Overall by Barron’s, Interactive Brokers. Trade stocks, options, futures, forex, bonds and funds on 135 markets, all from a single integrated account. Promoted
New: AI Stock Screener & Alerts
Our new AI Stock Screener scans the market every day to uncover opportunities.
• Dividend Powerhouses (3%+ Yield)
• Undervalued Small Caps with Insider Buying
• High growth Tech and AI Companies
Or build your own from over 50 metrics.
This article by Simply Wall St is general in nature. It does not constitute a recommendation to buy or sell any stock, and does not take account of your objectives, or your financial situation. We aim to bring you long-term focused analysis driven by fundamental data. Note that our analysis may not factor in the latest price-sensitive company announcements or qualitative material. Simply Wall St has no position in any stocks mentioned.
*Interactive Brokers Rated Lowest Cost Broker by StockBrokers.com Annual Online Review 2020
Have feedback on this article? Concerned about the content? Get in touch with us directly. Alternatively, email editorial-team@simplywallst.com.
About ENXTBR:CENER
Cenergy Holdings
Manufactures and sells aluminium, copper, cables, steel and steel pipes, and other related products in Belgium and internationally.
Solid track record and good value.

