

If you're not sure where to start when looking for the next multi-bagger, there are a few key trends you should keep an eye out for. Firstly, we'd want to identify a growing return on capital employed (ROCE) and then alongside that, an ever-increasing base of capital employed. This shows us that it's a compounding machine, able to continually reinvest its earnings back into the business and generate higher returns. In light of that, when we looked at Ackermans & Van Haaren (EBR:ACKB) and its ROCE trend, we weren't exactly thrilled.
Return On Capital Employed (ROCE): What Is It?
If you haven't worked with ROCE before, it measures the 'return' (pre-tax profit) a company generates from capital employed in its business. Analysts use this formula to calculate it for Ackermans & Van Haaren:
Return on Capital Employed = Earnings Before Interest and Tax (EBIT) ÷ (Total Assets - Current Liabilities)
0.056 = €514m ÷ (€19b - €9.8b) (Based on the trailing twelve months to December 2023).
Therefore, Ackermans & Van Haaren has an ROCE of 5.6%. In absolute terms, that's a low return and it also under-performs the Construction industry average of 7.3%.
View our latest analysis for Ackermans & Van Haaren
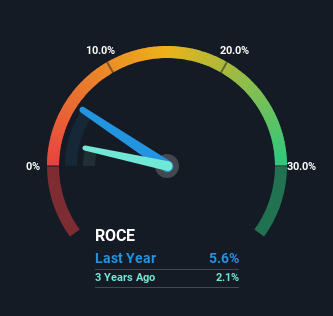
Above you can see how the current ROCE for Ackermans & Van Haaren compares to its prior returns on capital, but there's only so much you can tell from the past. If you'd like to see what analysts are forecasting going forward, you should check out our free analyst report for Ackermans & Van Haaren .
So How Is Ackermans & Van Haaren's ROCE Trending?
The returns on capital haven't changed much for Ackermans & Van Haaren in recent years. The company has consistently earned 5.6% for the last five years, and the capital employed within the business has risen 35% in that time. This poor ROCE doesn't inspire confidence right now, and with the increase in capital employed, it's evident that the business isn't deploying the funds into high return investments.
On a separate but related note, it's important to know that Ackermans & Van Haaren has a current liabilities to total assets ratio of 52%, which we'd consider pretty high. This effectively means that suppliers (or short-term creditors) are funding a large portion of the business, so just be aware that this can introduce some elements of risk. While it's not necessarily a bad thing, it can be beneficial if this ratio is lower.
The Key Takeaway
Long story short, while Ackermans & Van Haaren has been reinvesting its capital, the returns that it's generating haven't increased. And investors may be recognizing these trends since the stock has only returned a total of 25% to shareholders over the last five years. Therefore, if you're looking for a multi-bagger, we'd propose looking at other options.
Like most companies, Ackermans & Van Haaren does come with some risks, and we've found 1 warning sign that you should be aware of.
For those who like to invest in solid companies, check out this free list of companies with solid balance sheets and high returns on equity.
New: Manage All Your Stock Portfolios in One Place
We've created the ultimate portfolio companion for stock investors, and it's free.
• Connect an unlimited number of Portfolios and see your total in one currency
• Be alerted to new Warning Signs or Risks via email or mobile
• Track the Fair Value of your stocks
Have feedback on this article? Concerned about the content? Get in touch with us directly. Alternatively, email editorial-team (at) simplywallst.com.
This article by Simply Wall St is general in nature. We provide commentary based on historical data and analyst forecasts only using an unbiased methodology and our articles are not intended to be financial advice. It does not constitute a recommendation to buy or sell any stock, and does not take account of your objectives, or your financial situation. We aim to bring you long-term focused analysis driven by fundamental data. Note that our analysis may not factor in the latest price-sensitive company announcements or qualitative material. Simply Wall St has no position in any stocks mentioned.
About ENXTBR:ACKB
Ackermans & Van Haaren
Engages in marine engineering and contracting, private banking, real estate and senior care, and energy and resources businesses worldwide.
Excellent balance sheet average dividend payer.
