
Advertisement
Take Care Before Diving Into The Deep End On Superloop Limited (ASX:SLC)
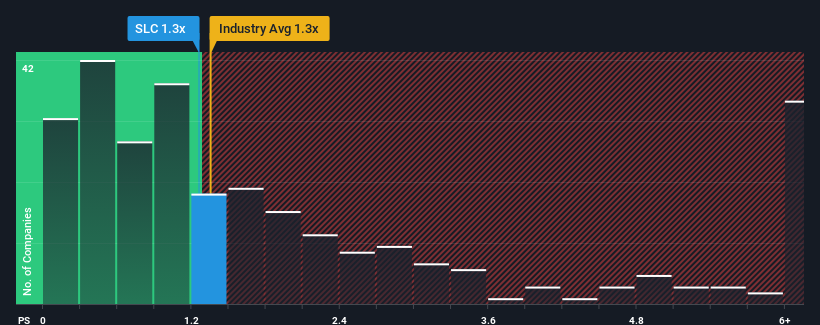
With a median price-to-sales (or "P/S") ratio of close to 1.1x in the Telecom industry in Australia, you could be forgiven for feeling indifferent about Superloop Limited's (ASX:SLC) P/S ratio of 1.3x. While this might not raise any eyebrows, if the P/S ratio is not justified investors could be missing out on a potential opportunity or ignoring looming disappointment.
See our latest analysis for Superloop
How Superloop Has Been Performing
With revenue growth that's superior to most other companies of late, Superloop has been doing relatively well. One possibility is that the P/S ratio is moderate because investors think this strong revenue performance might be about to tail off. If the company manages to stay the course, then investors should be rewarded with a share price that matches its revenue figures.
If you'd like to see what analysts are forecasting going forward, you should check out our free report on Superloop.What Are Revenue Growth Metrics Telling Us About The P/S?
Superloop's P/S ratio would be typical for a company that's only expected to deliver moderate growth, and importantly, perform in line with the industry.
Taking a look back first, we see that the company grew revenue by an impressive 30% last year. The strong recent performance means it was also able to grow revenue by 202% in total over the last three years. So we can start by confirming that the company has done a great job of growing revenue over that time.
Looking ahead now, revenue is anticipated to climb by 16% per annum during the coming three years according to the three analysts following the company. Meanwhile, the rest of the industry is forecast to only expand by 3.9% per year, which is noticeably less attractive.
In light of this, it's curious that Superloop's P/S sits in line with the majority of other companies. It may be that most investors aren't convinced the company can achieve future growth expectations.
What We Can Learn From Superloop's P/S?
Typically, we'd caution against reading too much into price-to-sales ratios when settling on investment decisions, though it can reveal plenty about what other market participants think about the company.
Looking at Superloop's analyst forecasts revealed that its superior revenue outlook isn't giving the boost to its P/S that we would've expected. When we see a strong revenue outlook, with growth outpacing the industry, we can only assume potential uncertainty around these figures are what might be placing slight pressure on the P/S ratio. At least the risk of a price drop looks to be subdued, but investors seem to think future revenue could see some volatility.
The company's balance sheet is another key area for risk analysis. Our free balance sheet analysis for Superloop with six simple checks will allow you to discover any risks that could be an issue.
If strong companies turning a profit tickle your fancy, then you'll want to check out this free list of interesting companies that trade on a low P/E (but have proven they can grow earnings).
New: Manage All Your Stock Portfolios in One Place
We've created the ultimate portfolio companion for stock investors, and it's free.
• Connect an unlimited number of Portfolios and see your total in one currency
• Be alerted to new Warning Signs or Risks via email or mobile
• Track the Fair Value of your stocks
Have feedback on this article? Concerned about the content? Get in touch with us directly. Alternatively, email editorial-team (at) simplywallst.com.
This article by Simply Wall St is general in nature. We provide commentary based on historical data and analyst forecasts only using an unbiased methodology and our articles are not intended to be financial advice. It does not constitute a recommendation to buy or sell any stock, and does not take account of your objectives, or your financial situation. We aim to bring you long-term focused analysis driven by fundamental data. Note that our analysis may not factor in the latest price-sensitive company announcements or qualitative material. Simply Wall St has no position in any stocks mentioned.
About ASX:SLC
Superloop
Operates as a telecommunications and internet service provider in Australia.
Excellent balance sheet and good value.
Market Insights

Advertisement
Weekly Picks
FA

FAI on Arabian Internet and Communication Services ·
Solutions by stc: 34% Upside in Saudi's Digital Transformation Leader
Fair Value:ر.س342.2335.3% undervalued
9 followersusers have followed this narrative
1 commentusers have commented on this narrative
3 likesusers have liked this narrative
RO


RobertoAllende on NVIDIA ·
The AI Infrastructure Giant Grows Into Its Valuation
Fair Value:US$345.0747.9% undervalued
27 followersusers have followed this narrative
28 commentsusers have commented on this narrative
21 likesusers have liked this narrative
Recently Updated Narratives
TA


Talos on POET Technologies ·
The Hidden Gem of AI Hardware – Solving the Data Center Bottleneck
Fair Value:US$17.3773.5% undervalued
1 followerusers have followed this narrative
0 commentsusers have commented on this narrative
0 likesusers have liked this narrative
TA

Talos on Recursion Pharmaceuticals ·
Moving from "Science Fiction" to "Science Fact" – A Bullish Valuation Case
Fair Value:US$12.4965.1% undervalued
1 followerusers have followed this narrative
0 commentsusers have commented on this narrative
0 likesusers have liked this narrative
HA

Haha94 on Perdana Petroleum Berhad ·
Perdana Petroleum Berhad is a Zombie Business with a 27.34% Profit Margin and inflation adjusted revenue Business
Fair Value:RM 0.2128.6% undervalued
1 followerusers have followed this narrative
0 commentsusers have commented on this narrative
0 likesusers have liked this narrative
Popular Narratives
TH


TheWallstreetKing on MicroVision ·
MicroVision will explode future revenue by 380.37% with a vision towards success
Fair Value:US$6098.6% undervalued
110 followersusers have followed this narrative
11 commentsusers have commented on this narrative
22 likesusers have liked this narrative
AN

AnalystConsensusTarget on NVIDIA ·
NVDA: Expanding AI Demand Will Drive Major Data Center Investments Through 2026
Fair Value:US$250.3928.1% undervalued
943 followersusers have followed this narrative
6 commentsusers have commented on this narrative
24 likesusers have liked this narrative
OS


oscargarcia on Alphabet ·
The company that turned a verb into a global necessity and basically runs the modern internet, digital ads, smartphones, maps, and AI.
Fair Value:US$3407.4% undervalued
145 followersusers have followed this narrative
6 commentsusers have commented on this narrative
18 likesusers have liked this narrative