Advertisement
Has Codan Limited's (ASX:CDA) Impressive Stock Performance Got Anything to Do With Its Fundamentals?
Codan's (ASX:CDA) stock is up by a considerable 20% over the past month. As most would know, fundamentals are what usually guide market price movements over the long-term, so we decided to look at the company's key financial indicators today to determine if they have any role to play in the recent price movement. Particularly, we will be paying attention to Codan's ROE today.
Return on equity or ROE is a key measure used to assess how efficiently a company's management is utilizing the company's capital. In simpler terms, it measures the profitability of a company in relation to shareholder's equity.
See our latest analysis for Codan
How To Calculate Return On Equity?
The formula for ROE is:
Return on Equity = Net Profit (from continuing operations) ÷ Shareholders' Equity
So, based on the above formula, the ROE for Codan is:
18% = AU$75m ÷ AU$406m (Based on the trailing twelve months to December 2023).
The 'return' refers to a company's earnings over the last year. Another way to think of that is that for every A$1 worth of equity, the company was able to earn A$0.18 in profit.
What Has ROE Got To Do With Earnings Growth?
We have already established that ROE serves as an efficient profit-generating gauge for a company's future earnings. Based on how much of its profits the company chooses to reinvest or "retain", we are then able to evaluate a company's future ability to generate profits. Assuming everything else remains unchanged, the higher the ROE and profit retention, the higher the growth rate of a company compared to companies that don't necessarily bear these characteristics.
Codan's Earnings Growth And 18% ROE
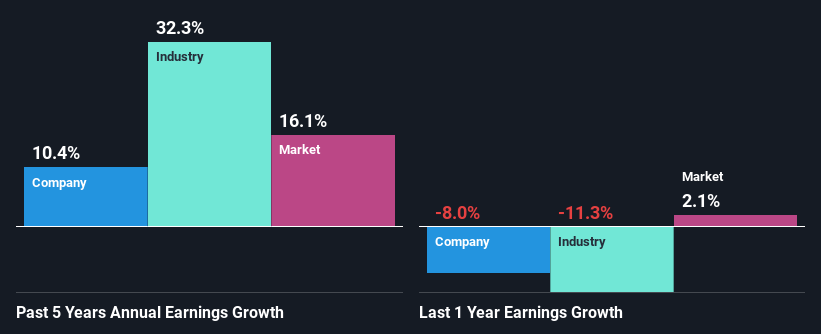
To start with, Codan's ROE looks acceptable. Especially when compared to the industry average of 9.5% the company's ROE looks pretty impressive. Probably as a result of this, Codan was able to see a decent growth of 10% over the last five years.
As a next step, we compared Codan's net income growth with the industry and were disappointed to see that the company's growth is lower than the industry average growth of 32% in the same period.
Earnings growth is a huge factor in stock valuation. The investor should try to establish if the expected growth or decline in earnings, whichever the case may be, is priced in. By doing so, they will have an idea if the stock is headed into clear blue waters or if swampy waters await. What is CDA worth today? The intrinsic value infographic in our free research report helps visualize whether CDA is currently mispriced by the market.
Is Codan Making Efficient Use Of Its Profits?
The high three-year median payout ratio of 52% (or a retention ratio of 48%) for Codan suggests that the company's growth wasn't really hampered despite it returning most of its income to its shareholders.
Besides, Codan has been paying dividends for at least ten years or more. This shows that the company is committed to sharing profits with its shareholders. Our latest analyst data shows that the future payout ratio of the company over the next three years is expected to be approximately 48%. Accordingly, forecasts suggest that Codan's future ROE will be 21% which is again, similar to the current ROE.
Conclusion
In total, it does look like Codan has some positive aspects to its business. Its earnings growth is decent, and the high ROE does contribute to that growth. However, investors could have benefitted even more from the high ROE, had the company been reinvesting more of its earnings. That being so, the latest analyst forecasts show that the company will continue to see an expansion in its earnings. Are these analysts expectations based on the broad expectations for the industry, or on the company's fundamentals? Click here to be taken to our analyst's forecasts page for the company.
New: AI Stock Screener & Alerts
Our new AI Stock Screener scans the market every day to uncover opportunities.
• Dividend Powerhouses (3%+ Yield)
• Undervalued Small Caps with Insider Buying
• High growth Tech and AI Companies
Or build your own from over 50 metrics.
Have feedback on this article? Concerned about the content? Get in touch with us directly. Alternatively, email editorial-team (at) simplywallst.com.
This article by Simply Wall St is general in nature. We provide commentary based on historical data and analyst forecasts only using an unbiased methodology and our articles are not intended to be financial advice. It does not constitute a recommendation to buy or sell any stock, and does not take account of your objectives, or your financial situation. We aim to bring you long-term focused analysis driven by fundamental data. Note that our analysis may not factor in the latest price-sensitive company announcements or qualitative material. Simply Wall St has no position in any stocks mentioned.
About ASX:CDA
Codan
Develops technology solutions for United Nations organizations, security and military agencies, government departments, corporates, individuals consumers, and small-scale miners.
Outstanding track record with excellent balance sheet.
Similar Companies
Market Insights

Advertisement
Weekly Picks
LO


Lou_Basenese on Optimi Health ·
The Only Psychedelic Company Already Selling MDMA and Psilocybin to Real Patients, Yet Priced Like It Doesn’t Exist
Fair Value:US$1156.8% undervalued
31 followersusers have followed this narrative
2 commentsusers have commented on this narrative
6 likesusers have liked this narrative
WE


WealthAP on Novo Nordisk ·
Novo Nordisk (NVO): Is the "Easy Growth" Story Over?
Fair Value:DKK 407.7721.6% undervalued
47 followersusers have followed this narrative
0 commentsusers have commented on this narrative
4 likesusers have liked this narrative
VA


ValueInvestingSubstack on Zoetis ·
Zoetis down -50% over the past year
Fair Value:US$92.9218.9% undervalued
12 followersusers have followed this narrative
0 commentsusers have commented on this narrative
6 likesusers have liked this narrative
CE


CentryResearch on Centrus Energy ·
Centrus Energy: The Next Nuclear Bottleneck Isn't Reactors. It's Fuel.
Fair Value:US$1909.9% undervalued
7 followersusers have followed this narrative
0 commentsusers have commented on this narrative
3 likesusers have liked this narrative
Recently Updated Narratives
ST


StoxEurope on KBC Group ·
KBC Group (ENXTBR:KBC) Valuation Deep-Dive: Why Dividend and Book Value Models Point in Opposite Directions.
Fair Value:€116.944.9% overvalued
1 followerusers have followed this narrative
0 commentsusers have commented on this narrative
0 likesusers have liked this narrative
FU

FundamentalFlow on Samsung Electronics ·
Samsung electronics, the DRAM bottleneck, leading the memory shortage wave?
Fair Value:₩500k47.9% undervalued
2 followersusers have followed this narrative
0 commentsusers have commented on this narrative
0 likesusers have liked this narrative
DI


divine_4y1uv on PRG Holdings Berhad ·
Dato’ Ng Yan Cheng Perjelaskan Pendahuluan RM89.55 Juta Bagi Menyokong Kewangan Syarikat
Fair Value:RM 0.361.7% undervalued
1 followerusers have followed this narrative
0 commentsusers have commented on this narrative
0 likesusers have liked this narrative
Popular Narratives
IN

Investingwilly on Mastercard ·
Mastercard: The Best Dividend Stock You're Ignoring
Fair Value:US$75028.2% undervalued
100 followersusers have followed this narrative
1 commentusers have commented on this narrative
9 likesusers have liked this narrative
BE

benjamin_lvieq on PayPal Holdings ·
PayPal: PayPal Doesn't Need to Grow – It Needs to Stop Falling – A Mispriced Cash Machine With a Cannibal Buyback
Fair Value:US$6514.1% undervalued
69 followersusers have followed this narrative
2 commentsusers have commented on this narrative
10 likesusers have liked this narrative
BL


BlackGoat on Cerebras Systems ·
The Wafer Giant Threatening NVIDIA's GPU Hegemony
Fair Value:US$415.5449.8% undervalued
64 followersusers have followed this narrative
3 commentsusers have commented on this narrative
11 likesusers have liked this narrative
Trending Discussion
BE
benjamin_lvieq on PayPal Holdings ·
An investment case is not about loving the product. Its about price vs reality.
2
|0
ST

StoxEurope on Koninklijke Ahold Delhaize ·
I ran Ahold Delhaize through a three-model triangulation — DCF, dividend discount, and residual inco...
1
|0

