Are Robust Financials Driving The Recent Rally In WiseTech Global Limited's (ASX:WTC) Stock?

WiseTech Global (ASX:WTC) has had a great run on the share market with its stock up by a significant 23% over the last three months. Given the company's impressive performance, we decided to study its financial indicators more closely as a company's financial health over the long-term usually dictates market outcomes. Particularly, we will be paying attention to WiseTech Global's ROE today.
Return on Equity or ROE is a test of how effectively a company is growing its value and managing investors’ money. Put another way, it reveals the company's success at turning shareholder investments into profits.
Check out our latest analysis for WiseTech Global
How To Calculate Return On Equity?
ROE can be calculated by using the formula:
Return on Equity = Net Profit (from continuing operations) ÷ Shareholders' Equity
So, based on the above formula, the ROE for WiseTech Global is:
11% = AU$221m ÷ AU$2.0b (Based on the trailing twelve months to December 2023).
The 'return' is the income the business earned over the last year. Another way to think of that is that for every A$1 worth of equity, the company was able to earn A$0.11 in profit.
What Is The Relationship Between ROE And Earnings Growth?
So far, we've learned that ROE is a measure of a company's profitability. Depending on how much of these profits the company reinvests or "retains", and how effectively it does so, we are then able to assess a company’s earnings growth potential. Generally speaking, other things being equal, firms with a high return on equity and profit retention, have a higher growth rate than firms that don’t share these attributes.
A Side By Side comparison of WiseTech Global's Earnings Growth And 11% ROE
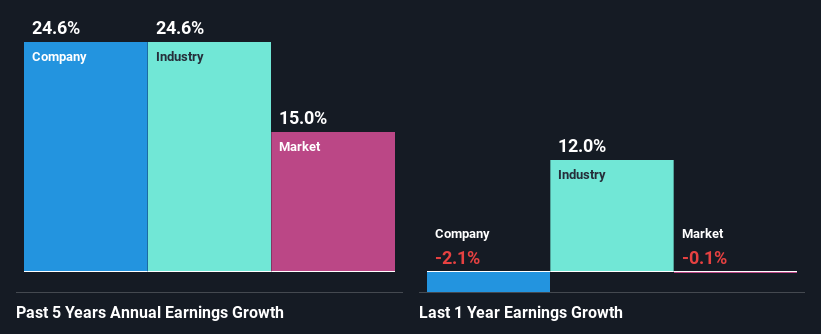
At first glance, WiseTech Global seems to have a decent ROE. Even when compared to the industry average of 9.5% the company's ROE looks quite decent. Consequently, this likely laid the ground for the impressive net income growth of 25% seen over the past five years by WiseTech Global. However, there could also be other drivers behind this growth. For instance, the company has a low payout ratio or is being managed efficiently.
We then performed a comparison between WiseTech Global's net income growth with the industry, which revealed that the company's growth is similar to the average industry growth of 25% in the same 5-year period.
Earnings growth is a huge factor in stock valuation. What investors need to determine next is if the expected earnings growth, or the lack of it, is already built into the share price. Doing so will help them establish if the stock's future looks promising or ominous. Is WiseTech Global fairly valued compared to other companies? These 3 valuation measures might help you decide.
Is WiseTech Global Making Efficient Use Of Its Profits?
WiseTech Global's ' three-year median payout ratio is on the lower side at 20% implying that it is retaining a higher percentage (80%) of its profits. So it looks like WiseTech Global is reinvesting profits heavily to grow its business, which shows in its earnings growth.
Besides, WiseTech Global has been paying dividends over a period of seven years. This shows that the company is committed to sharing profits with its shareholders. Our latest analyst data shows that the future payout ratio of the company over the next three years is expected to be approximately 22%. Still, forecasts suggest that WiseTech Global's future ROE will rise to 20% even though the the company's payout ratio is not expected to change by much.
Conclusion
Overall, we are quite pleased with WiseTech Global's performance. Particularly, we like that the company is reinvesting heavily into its business, and at a high rate of return. Unsurprisingly, this has led to an impressive earnings growth. On studying current analyst estimates, we found that analysts expect the company to continue its recent growth streak. Are these analysts expectations based on the broad expectations for the industry, or on the company's fundamentals? Click here to be taken to our analyst's forecasts page for the company.
The New Payments ETF Is Live on NASDAQ:
Money is moving to real-time rails, and a newly listed ETF now gives investors direct exposure. Fast settlement. Institutional custody. Simple access.
Explore how this launch could reshape portfolios
Sponsored ContentValuation is complex, but we're here to simplify it.
Discover if WiseTech Global might be undervalued or overvalued with our detailed analysis, featuring fair value estimates, potential risks, dividends, insider trades, and its financial condition.
Access Free AnalysisHave feedback on this article? Concerned about the content? Get in touch with us directly. Alternatively, email editorial-team (at) simplywallst.com.
This article by Simply Wall St is general in nature. We provide commentary based on historical data and analyst forecasts only using an unbiased methodology and our articles are not intended to be financial advice. It does not constitute a recommendation to buy or sell any stock, and does not take account of your objectives, or your financial situation. We aim to bring you long-term focused analysis driven by fundamental data. Note that our analysis may not factor in the latest price-sensitive company announcements or qualitative material. Simply Wall St has no position in any stocks mentioned.
About ASX:WTC
WiseTech Global
Engages in the development and provision of software solutions to the logistics execution industry in the Americas, the Asia Pacific, Europe, the Middle East, and Africa.
Excellent balance sheet with reasonable growth potential.
Similar Companies
Market Insights

Weekly Picks

THE KINGDOM OF BROWN GOODS: WHY MGPI IS BEING CRUSHED BY INVENTORY & PRIMED FOR RESURRECTION


Why Vertical Aerospace (NYSE: EVTL) is Worth Possibly Over 13x its Current Price


The Quiet Giant That Became AI’s Power Grid
Recently Updated Narratives


A tech powerhouse quietly powering the world’s AI infrastructure.


Keppel DC REIT (SGX: AJBU) is a resilient gem in the data center space.
Why Vertical Aerospace (NYSE: EVTL) is Worth Possibly Over 13x its Current Price
Popular Narratives

MicroVision will explode future revenue by 380.37% with a vision towards success


Crazy Undervalued 42 Baggers Silver Play (Active & Running Mine)


