Is There An Opportunity With Symbio Holdings Limited's (ASX:SYM) 21% Undervaluation?

Key Insights
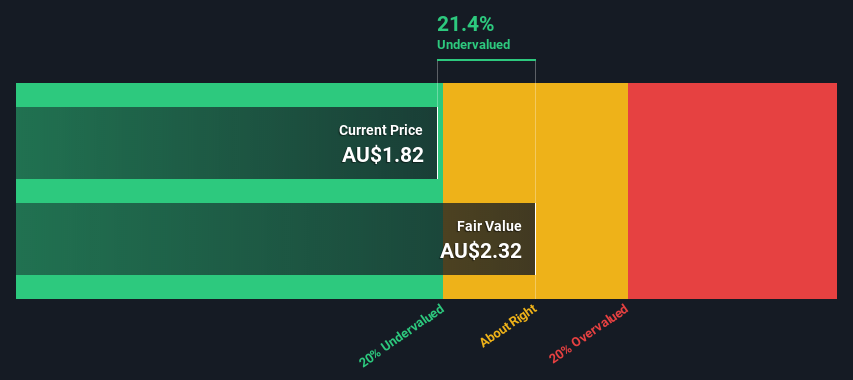
- The projected fair value for Symbio Holdings is AU$2.32 based on 2 Stage Free Cash Flow to Equity
- Symbio Holdings' AU$1.82 share price signals that it might be 21% undervalued
- Peers of Symbio Holdings are currently trading on average at a 116% premium
Does the March share price for Symbio Holdings Limited (ASX:SYM) reflect what it's really worth? Today, we will estimate the stock's intrinsic value by estimating the company's future cash flows and discounting them to their present value. We will take advantage of the Discounted Cash Flow (DCF) model for this purpose. It may sound complicated, but actually it is quite simple!
We generally believe that a company's value is the present value of all of the cash it will generate in the future. However, a DCF is just one valuation metric among many, and it is not without flaws. For those who are keen learners of equity analysis, the Simply Wall St analysis model here may be something of interest to you.
See our latest analysis for Symbio Holdings
What's The Estimated Valuation?
We're using the 2-stage growth model, which simply means we take in account two stages of company's growth. In the initial period the company may have a higher growth rate and the second stage is usually assumed to have a stable growth rate. To start off with, we need to estimate the next ten years of cash flows. Where possible we use analyst estimates, but when these aren't available we extrapolate the previous free cash flow (FCF) from the last estimate or reported value. We assume companies with shrinking free cash flow will slow their rate of shrinkage, and that companies with growing free cash flow will see their growth rate slow, over this period. We do this to reflect that growth tends to slow more in the early years than it does in later years.
Generally we assume that a dollar today is more valuable than a dollar in the future, and so the sum of these future cash flows is then discounted to today's value:
10-year free cash flow (FCF) estimate
| 2023 | 2024 | 2025 | 2026 | 2027 | 2028 | 2029 | 2030 | 2031 | 2032 | |
| Levered FCF (A$, Millions) | AU$4.00m | -AU$2.60m | AU$7.40m | AU$9.48m | AU$11.4m | AU$13.1m | AU$14.5m | AU$15.7m | AU$16.7m | AU$17.5m |
| Growth Rate Estimate Source | Analyst x2 | Analyst x1 | Analyst x1 | Est @ 28.12% | Est @ 20.26% | Est @ 14.76% | Est @ 10.91% | Est @ 8.22% | Est @ 6.33% | Est @ 5.01% |
| Present Value (A$, Millions) Discounted @ 8.1% | AU$3.7 | -AU$2.2 | AU$5.9 | AU$6.9 | AU$7.7 | AU$8.2 | AU$8.4 | AU$8.4 | AU$8.3 | AU$8.1 |
("Est" = FCF growth rate estimated by Simply Wall St)
Present Value of 10-year Cash Flow (PVCF) = AU$63m
The second stage is also known as Terminal Value, this is the business's cash flow after the first stage. For a number of reasons a very conservative growth rate is used that cannot exceed that of a country's GDP growth. In this case we have used the 5-year average of the 10-year government bond yield (1.9%) to estimate future growth. In the same way as with the 10-year 'growth' period, we discount future cash flows to today's value, using a cost of equity of 8.1%.
Terminal Value (TV)= FCF2032 × (1 + g) ÷ (r – g) = AU$18m× (1 + 1.9%) ÷ (8.1%– 1.9%) = AU$290m
Present Value of Terminal Value (PVTV)= TV / (1 + r)10= AU$290m÷ ( 1 + 8.1%)10= AU$133m
The total value, or equity value, is then the sum of the present value of the future cash flows, which in this case is AU$196m. To get the intrinsic value per share, we divide this by the total number of shares outstanding. Compared to the current share price of AU$1.8, the company appears a touch undervalued at a 21% discount to where the stock price trades currently. Remember though, that this is just an approximate valuation, and like any complex formula - garbage in, garbage out.
Important Assumptions
We would point out that the most important inputs to a discounted cash flow are the discount rate and of course the actual cash flows. If you don't agree with these result, have a go at the calculation yourself and play with the assumptions. The DCF also does not consider the possible cyclicality of an industry, or a company's future capital requirements, so it does not give a full picture of a company's potential performance. Given that we are looking at Symbio Holdings as potential shareholders, the cost of equity is used as the discount rate, rather than the cost of capital (or weighted average cost of capital, WACC) which accounts for debt. In this calculation we've used 8.1%, which is based on a levered beta of 1.038. Beta is a measure of a stock's volatility, compared to the market as a whole. We get our beta from the industry average beta of globally comparable companies, with an imposed limit between 0.8 and 2.0, which is a reasonable range for a stable business.
SWOT Analysis for Symbio Holdings
- Currently debt free.
- Earnings declined over the past year.
- Dividend is low compared to the top 25% of dividend payers in the Software market.
- Annual earnings are forecast to grow faster than the Australian market.
- Trading below our estimate of fair value by more than 20%.
- Dividends are not covered by earnings.
Next Steps:
Whilst important, the DCF calculation is only one of many factors that you need to assess for a company. It's not possible to obtain a foolproof valuation with a DCF model. Instead the best use for a DCF model is to test certain assumptions and theories to see if they would lead to the company being undervalued or overvalued. For instance, if the terminal value growth rate is adjusted slightly, it can dramatically alter the overall result. Why is the intrinsic value higher than the current share price? For Symbio Holdings, we've put together three fundamental aspects you should assess:
- Risks: We feel that you should assess the 1 warning sign for Symbio Holdings we've flagged before making an investment in the company.
- Future Earnings: How does SYM's growth rate compare to its peers and the wider market? Dig deeper into the analyst consensus number for the upcoming years by interacting with our free analyst growth expectation chart.
- Other High Quality Alternatives: Do you like a good all-rounder? Explore our interactive list of high quality stocks to get an idea of what else is out there you may be missing!
PS. Simply Wall St updates its DCF calculation for every Australian stock every day, so if you want to find the intrinsic value of any other stock just search here.
Mobile Infrastructure for Defense and Disaster
The next wave in robotics isn't humanoid. Its fully autonomous towers delivering 5G, ISR, and radar in under 30 minutes, anywhere.
Get the investor briefing before the next round of contracts
Sponsored On Behalf of CiTechNew: Manage All Your Stock Portfolios in One Place
We've created the ultimate portfolio companion for stock investors, and it's free.
• Connect an unlimited number of Portfolios and see your total in one currency
• Be alerted to new Warning Signs or Risks via email or mobile
• Track the Fair Value of your stocks
Have feedback on this article? Concerned about the content? Get in touch with us directly. Alternatively, email editorial-team (at) simplywallst.com.
This article by Simply Wall St is general in nature. We provide commentary based on historical data and analyst forecasts only using an unbiased methodology and our articles are not intended to be financial advice. It does not constitute a recommendation to buy or sell any stock, and does not take account of your objectives, or your financial situation. We aim to bring you long-term focused analysis driven by fundamental data. Note that our analysis may not factor in the latest price-sensitive company announcements or qualitative material. Simply Wall St has no position in any stocks mentioned.
About ASX:SYM
Symbio Holdings
Symbio Holdings Limited provides communication services to software companies, telecom providers, and enterprise customers in Australia, New Zealand, and Internationally.
Flawless balance sheet with reasonable growth potential.
Market Insights

Weekly Picks

THE KINGDOM OF BROWN GOODS: WHY MGPI IS BEING CRUSHED BY INVENTORY & PRIMED FOR RESURRECTION


Why Vertical Aerospace (NYSE: EVTL) is Worth Possibly Over 13x its Current Price


The Quiet Giant That Became AI’s Power Grid
Recently Updated Narratives


MINISO's fair value is projected at 26.69 with an anticipated PE ratio shift of 20x

Fiverr International will transform the freelance industry with AI-powered growth

Jackson Financial Stock: When Insurance Math Meets a Shifting Claims Landscape
Popular Narratives


MicroVision will explode future revenue by 380.37% with a vision towards success


Crazy Undervalued 42 Baggers Silver Play (Active & Running Mine)


