
Advertisement
Calculating The Intrinsic Value Of RPMGlobal Holdings Limited (ASX:RUL)
Key Insights
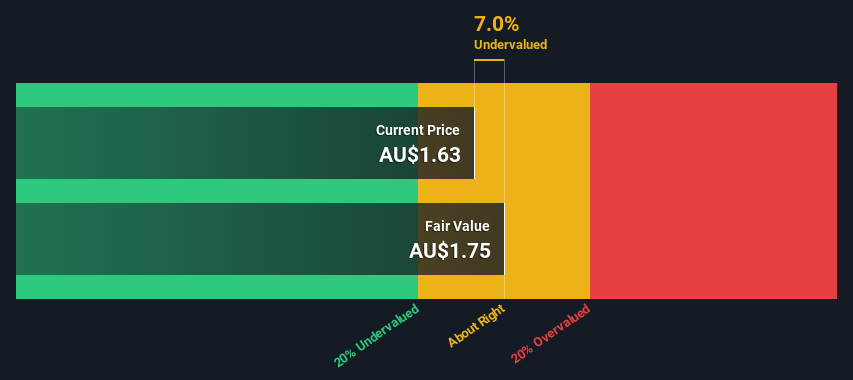
- RPMGlobal Holdings' estimated fair value is AU$1.75 based on 2 Stage Free Cash Flow to Equity
- With AU$1.63 share price, RPMGlobal Holdings appears to be trading close to its estimated fair value
- RPMGlobal Holdings' peers are currently trading at a premium of 19% on average
Does the July share price for RPMGlobal Holdings Limited (ASX:RUL) reflect what it's really worth? Today, we will estimate the stock's intrinsic value by taking the forecast future cash flows of the company and discounting them back to today's value. We will take advantage of the Discounted Cash Flow (DCF) model for this purpose. There's really not all that much to it, even though it might appear quite complex.
Remember though, that there are many ways to estimate a company's value, and a DCF is just one method. If you still have some burning questions about this type of valuation, take a look at the Simply Wall St analysis model.
See our latest analysis for RPMGlobal Holdings
Crunching The Numbers
We are going to use a two-stage DCF model, which, as the name states, takes into account two stages of growth. The first stage is generally a higher growth period which levels off heading towards the terminal value, captured in the second 'steady growth' period. To start off with, we need to estimate the next ten years of cash flows. Where possible we use analyst estimates, but when these aren't available we extrapolate the previous free cash flow (FCF) from the last estimate or reported value. We assume companies with shrinking free cash flow will slow their rate of shrinkage, and that companies with growing free cash flow will see their growth rate slow, over this period. We do this to reflect that growth tends to slow more in the early years than it does in later years.
Generally we assume that a dollar today is more valuable than a dollar in the future, so we need to discount the sum of these future cash flows to arrive at a present value estimate:
10-year free cash flow (FCF) forecast
| 2024 | 2025 | 2026 | 2027 | 2028 | 2029 | 2030 | 2031 | 2032 | 2033 | |
| Levered FCF (A$, Millions) | AU$12.8m | AU$16.7m | AU$19.6m | AU$22.2m | AU$24.3m | AU$26.1m | AU$27.6m | AU$28.9m | AU$30.0m | AU$30.9m |
| Growth Rate Estimate Source | Analyst x1 | Analyst x1 | Est @ 17.63% | Est @ 12.93% | Est @ 9.64% | Est @ 7.33% | Est @ 5.72% | Est @ 4.59% | Est @ 3.80% | Est @ 3.25% |
| Present Value (A$, Millions) Discounted @ 7.9% | AU$11.9 | AU$14.3 | AU$15.6 | AU$16.4 | AU$16.6 | AU$16.5 | AU$16.2 | AU$15.7 | AU$15.1 | AU$14.4 |
("Est" = FCF growth rate estimated by Simply Wall St)
Present Value of 10-year Cash Flow (PVCF) = AU$153m
We now need to calculate the Terminal Value, which accounts for all the future cash flows after this ten year period. For a number of reasons a very conservative growth rate is used that cannot exceed that of a country's GDP growth. In this case we have used the 5-year average of the 10-year government bond yield (2.0%) to estimate future growth. In the same way as with the 10-year 'growth' period, we discount future cash flows to today's value, using a cost of equity of 7.9%.
Terminal Value (TV)= FCF2033 × (1 + g) ÷ (r – g) = AU$31m× (1 + 2.0%) ÷ (7.9%– 2.0%) = AU$529m
Present Value of Terminal Value (PVTV)= TV / (1 + r)10= AU$529m÷ ( 1 + 7.9%)10= AU$247m
The total value is the sum of cash flows for the next ten years plus the discounted terminal value, which results in the Total Equity Value, which in this case is AU$400m. In the final step we divide the equity value by the number of shares outstanding. Compared to the current share price of AU$1.6, the company appears about fair value at a 7.0% discount to where the stock price trades currently. Valuations are imprecise instruments though, rather like a telescope - move a few degrees and end up in a different galaxy. Do keep this in mind.
The Assumptions
We would point out that the most important inputs to a discounted cash flow are the discount rate and of course the actual cash flows. If you don't agree with these result, have a go at the calculation yourself and play with the assumptions. The DCF also does not consider the possible cyclicality of an industry, or a company's future capital requirements, so it does not give a full picture of a company's potential performance. Given that we are looking at RPMGlobal Holdings as potential shareholders, the cost of equity is used as the discount rate, rather than the cost of capital (or weighted average cost of capital, WACC) which accounts for debt. In this calculation we've used 7.9%, which is based on a levered beta of 1.003. Beta is a measure of a stock's volatility, compared to the market as a whole. We get our beta from the industry average beta of globally comparable companies, with an imposed limit between 0.8 and 2.0, which is a reasonable range for a stable business.
Next Steps:
Whilst important, the DCF calculation shouldn't be the only metric you look at when researching a company. It's not possible to obtain a foolproof valuation with a DCF model. Rather it should be seen as a guide to "what assumptions need to be true for this stock to be under/overvalued?" For instance, if the terminal value growth rate is adjusted slightly, it can dramatically alter the overall result. For RPMGlobal Holdings, we've compiled three relevant items you should further examine:
- Financial Health: Does RUL have a healthy balance sheet? Take a look at our free balance sheet analysis with six simple checks on key factors like leverage and risk.
- Future Earnings: How does RUL's growth rate compare to its peers and the wider market? Dig deeper into the analyst consensus number for the upcoming years by interacting with our free analyst growth expectation chart.
- Other Solid Businesses: Low debt, high returns on equity and good past performance are fundamental to a strong business. Why not explore our interactive list of stocks with solid business fundamentals to see if there are other companies you may not have considered!
PS. The Simply Wall St app conducts a discounted cash flow valuation for every stock on the ASX every day. If you want to find the calculation for other stocks just search here.
New: AI Stock Screener & Alerts
Our new AI Stock Screener scans the market every day to uncover opportunities.
• Dividend Powerhouses (3%+ Yield)
• Undervalued Small Caps with Insider Buying
• High growth Tech and AI Companies
Or build your own from over 50 metrics.
Have feedback on this article? Concerned about the content? Get in touch with us directly. Alternatively, email editorial-team (at) simplywallst.com.
This article by Simply Wall St is general in nature. We provide commentary based on historical data and analyst forecasts only using an unbiased methodology and our articles are not intended to be financial advice. It does not constitute a recommendation to buy or sell any stock, and does not take account of your objectives, or your financial situation. We aim to bring you long-term focused analysis driven by fundamental data. Note that our analysis may not factor in the latest price-sensitive company announcements or qualitative material. Simply Wall St has no position in any stocks mentioned.
About ASX:RUL
RPMGlobal Holdings
Develops and provides mining software solutions in Australia, Asia, the Americas, Africa, and Europe.
Flawless balance sheet with reasonable growth potential.
Market Insights

Advertisement
Weekly Picks
WO

woodworthfund on MGP Ingredients ·
THE KINGDOM OF BROWN GOODS: WHY MGPI IS BEING CRUSHED BY INVENTORY & PRIMED FOR RESURRECTION
Fair Value:US$4034.1% undervalued
18 followersusers have followed this narrative
1 commentusers have commented on this narrative
4 likesusers have liked this narrative
DO


Double_Bubbler on Vertical Aerospace ·
Why Vertical Aerospace (NYSE: EVTL) is Worth Possibly Over 13x its Current Price
Fair Value:US$6090.0% undervalued
21 followersusers have followed this narrative
2 commentsusers have commented on this narrative
17 likesusers have liked this narrative
TI


TickerTickle on Oracle ·
The Quiet Giant That Became AI’s Power Grid
Fair Value:US$389.8142.8% undervalued
38 followersusers have followed this narrative
3 commentsusers have commented on this narrative
8 likesusers have liked this narrative
Recently Updated Narratives
MH


mhbb on Mastersystem Infotama ·
Mastersystem Infotama will achieve 18.9% revenue growth as fair value hits IDR1,650
Fair Value:Rp1.63k12.9% undervalued
1 followerusers have followed this narrative
0 commentsusers have commented on this narrative
0 likesusers have liked this narrative
RO


Robbo on Procter & Gamble ·
Insiders Sell, Investors Watch: What’s Going On at PG?
Fair Value:US$1506.8% undervalued
1 followerusers have followed this narrative
0 commentsusers have commented on this narrative
0 likesusers have liked this narrative
CW

Cwburton on Verano Holdings ·
Waiting for the Inevitable
Fair Value:CA$5.5278.8% undervalued
2 followersusers have followed this narrative
0 commentsusers have commented on this narrative
0 likesusers have liked this narrative
Popular Narratives
TH


TheWallstreetKing on MicroVision ·
MicroVision will explode future revenue by 380.37% with a vision towards success
Fair Value:US$6098.5% undervalued
119 followersusers have followed this narrative
11 commentsusers have commented on this narrative
22 likesusers have liked this narrative
AN


AnalystConsensusTarget on NVIDIA ·
NVDA: Expanding AI Demand Will Drive Major Data Center Investments Through 2026
Fair Value:US$250.3926.6% undervalued
963 followersusers have followed this narrative
6 commentsusers have commented on this narrative
25 likesusers have liked this narrative
RO


RockeTeller on Santacruz Silver Mining ·
Crazy Undervalued 42 Baggers Silver Play (Active & Running Mine)
Fair Value:CA$8688.6% undervalued
77 followersusers have followed this narrative
8 commentsusers have commented on this narrative
21 likesusers have liked this narrative
