
Advertisement
Is There An Opportunity With FINEOS Corporation Holdings plc's (ASX:FCL) 49% Undervaluation?
Key Insights
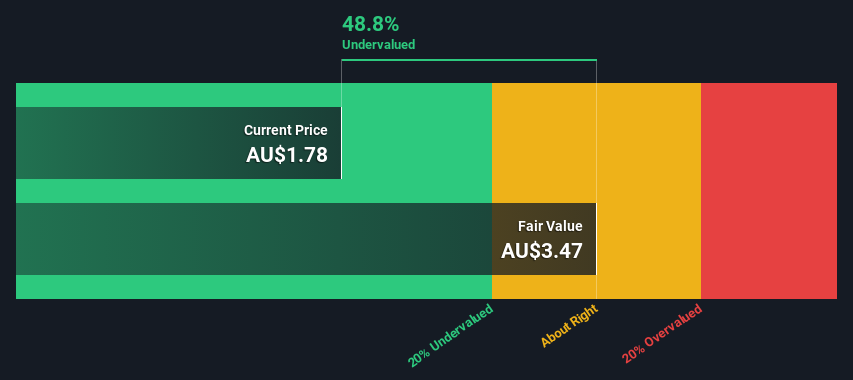
- FINEOS Corporation Holdings' estimated fair value is AU$3.47 based on 2 Stage Free Cash Flow to Equity
- Current share price of AU$1.78 suggests FINEOS Corporation Holdings is potentially 49% undervalued
- Our fair value estimate is 34% higher than FINEOS Corporation Holdings' analyst price target of €2.60
How far off is FINEOS Corporation Holdings plc (ASX:FCL) from its intrinsic value? Using the most recent financial data, we'll take a look at whether the stock is fairly priced by taking the expected future cash flows and discounting them to today's value. We will take advantage of the Discounted Cash Flow (DCF) model for this purpose. Before you think you won't be able to understand it, just read on! It's actually much less complex than you'd imagine.
We generally believe that a company's value is the present value of all of the cash it will generate in the future. However, a DCF is just one valuation metric among many, and it is not without flaws. If you want to learn more about discounted cash flow, the rationale behind this calculation can be read in detail in the Simply Wall St analysis model.
See our latest analysis for FINEOS Corporation Holdings
The Method
We use what is known as a 2-stage model, which simply means we have two different periods of growth rates for the company's cash flows. Generally the first stage is higher growth, and the second stage is a lower growth phase. In the first stage we need to estimate the cash flows to the business over the next ten years. Where possible we use analyst estimates, but when these aren't available we extrapolate the previous free cash flow (FCF) from the last estimate or reported value. We assume companies with shrinking free cash flow will slow their rate of shrinkage, and that companies with growing free cash flow will see their growth rate slow, over this period. We do this to reflect that growth tends to slow more in the early years than it does in later years.
Generally we assume that a dollar today is more valuable than a dollar in the future, so we need to discount the sum of these future cash flows to arrive at a present value estimate:
10-year free cash flow (FCF) estimate
| 2024 | 2025 | 2026 | 2027 | 2028 | 2029 | 2030 | 2031 | 2032 | 2033 | |
| Levered FCF (€, Millions) | -€14.0m | -€5.80m | €14.4m | €22.6m | €31.6m | €40.7m | €49.2m | €56.7m | €63.0m | €68.4m |
| Growth Rate Estimate Source | Analyst x1 | Analyst x1 | Analyst x1 | Est @ 56.60% | Est @ 40.24% | Est @ 28.79% | Est @ 20.78% | Est @ 15.17% | Est @ 11.24% | Est @ 8.49% |
| Present Value (€, Millions) Discounted @ 8.0% | -€13.0 | -€5.0 | €11.4 | €16.6 | €21.5 | €25.7 | €28.7 | €30.6 | €31.5 | €31.7 |
("Est" = FCF growth rate estimated by Simply Wall St)
Present Value of 10-year Cash Flow (PVCF) = €180m
We now need to calculate the Terminal Value, which accounts for all the future cash flows after this ten year period. The Gordon Growth formula is used to calculate Terminal Value at a future annual growth rate equal to the 5-year average of the 10-year government bond yield of 2.1%. We discount the terminal cash flows to today's value at a cost of equity of 8.0%.
Terminal Value (TV)= FCF2033 × (1 + g) ÷ (r – g) = €68m× (1 + 2.1%) ÷ (8.0%– 2.1%) = €1.2b
Present Value of Terminal Value (PVTV)= TV / (1 + r)10= €1.2b÷ ( 1 + 8.0%)10= €546m
The total value is the sum of cash flows for the next ten years plus the discounted terminal value, which results in the Total Equity Value, which in this case is €726m. In the final step we divide the equity value by the number of shares outstanding. Compared to the current share price of AU$1.8, the company appears quite good value at a 49% discount to where the stock price trades currently. Remember though, that this is just an approximate valuation, and like any complex formula - garbage in, garbage out.
Important Assumptions
We would point out that the most important inputs to a discounted cash flow are the discount rate and of course the actual cash flows. If you don't agree with these result, have a go at the calculation yourself and play with the assumptions. The DCF also does not consider the possible cyclicality of an industry, or a company's future capital requirements, so it does not give a full picture of a company's potential performance. Given that we are looking at FINEOS Corporation Holdings as potential shareholders, the cost of equity is used as the discount rate, rather than the cost of capital (or weighted average cost of capital, WACC) which accounts for debt. In this calculation we've used 8.0%, which is based on a levered beta of 1.002. Beta is a measure of a stock's volatility, compared to the market as a whole. We get our beta from the industry average beta of globally comparable companies, with an imposed limit between 0.8 and 2.0, which is a reasonable range for a stable business.
SWOT Analysis for FINEOS Corporation Holdings
Strength
- Currently debt free.
Weakness
- Shareholders have been diluted in the past year.
Opportunity
- Forecast to reduce losses next year.
- Good value based on P/S ratio and estimated fair value.
Threat
- Has less than 3 years of cash runway based on current free cash flow.
Next Steps:
Valuation is only one side of the coin in terms of building your investment thesis, and it is only one of many factors that you need to assess for a company. It's not possible to obtain a foolproof valuation with a DCF model. Preferably you'd apply different cases and assumptions and see how they would impact the company's valuation. If a company grows at a different rate, or if its cost of equity or risk free rate changes sharply, the output can look very different. Can we work out why the company is trading at a discount to intrinsic value? For FINEOS Corporation Holdings, we've put together three essential factors you should assess:
- Risks: You should be aware of the 1 warning sign for FINEOS Corporation Holdings we've uncovered before considering an investment in the company.
- Future Earnings: How does FCL's growth rate compare to its peers and the wider market? Dig deeper into the analyst consensus number for the upcoming years by interacting with our free analyst growth expectation chart.
- Other High Quality Alternatives: Do you like a good all-rounder? Explore our interactive list of high quality stocks to get an idea of what else is out there you may be missing!
PS. The Simply Wall St app conducts a discounted cash flow valuation for every stock on the ASX every day. If you want to find the calculation for other stocks just search here.
New: AI Stock Screener & Alerts
Our new AI Stock Screener scans the market every day to uncover opportunities.
• Dividend Powerhouses (3%+ Yield)
• Undervalued Small Caps with Insider Buying
• High growth Tech and AI Companies
Or build your own from over 50 metrics.
Have feedback on this article? Concerned about the content? Get in touch with us directly. Alternatively, email editorial-team (at) simplywallst.com.
This article by Simply Wall St is general in nature. We provide commentary based on historical data and analyst forecasts only using an unbiased methodology and our articles are not intended to be financial advice. It does not constitute a recommendation to buy or sell any stock, and does not take account of your objectives, or your financial situation. We aim to bring you long-term focused analysis driven by fundamental data. Note that our analysis may not factor in the latest price-sensitive company announcements or qualitative material. Simply Wall St has no position in any stocks mentioned.
About ASX:FCL
FINEOS Corporation Holdings
Engages in the development and sale of enterprise claims and policy management software for life, accident and health insurers, and employee benefits providers in North America, the Asia Pacific, the Middle East, and Africa.
Flawless balance sheet with reasonable growth potential.
Similar Companies
Market Insights

Advertisement
Community Narratives
MINISO's fair value is projected at 26.69 with an anticipated PE ratio shift of 20x
Fair Value US$24.03|11.0% undervalued
BE
Community Contributor
Procter & Gamble: A Dividend Giant Facing Slowing Growth
Fair Value US$119.81|23.3% overvalued
AN
Community Contributor
Eli Lilly's Future Growth Driven by Tirzepatide and Favorable Market Conditions
Fair Value US$1.19k|13.8% undervalued
EA
Community Contributor