Estimating The Intrinsic Value Of Wesfarmers Limited (ASX:WES)

Key Insights
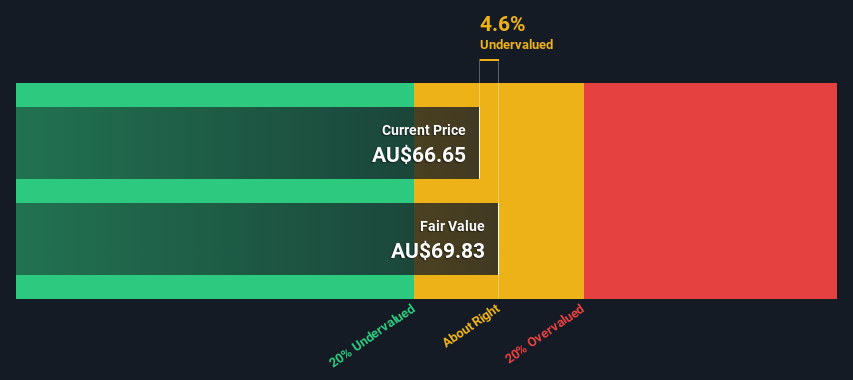
- Wesfarmers' estimated fair value is AU$69.83 based on 2 Stage Free Cash Flow to Equity
- Wesfarmers' AU$66.65 share price indicates it is trading at similar levels as its fair value estimate
- Our fair value estimate is 20% higher than Wesfarmers' analyst price target of AU$58.07
Does the April share price for Wesfarmers Limited (ASX:WES) reflect what it's really worth? Today, we will estimate the stock's intrinsic value by taking the expected future cash flows and discounting them to today's value. Our analysis will employ the Discounted Cash Flow (DCF) model. It may sound complicated, but actually it is quite simple!
We generally believe that a company's value is the present value of all of the cash it will generate in the future. However, a DCF is just one valuation metric among many, and it is not without flaws. For those who are keen learners of equity analysis, the Simply Wall St analysis model here may be something of interest to you.
See our latest analysis for Wesfarmers
The Calculation
We're using the 2-stage growth model, which simply means we take in account two stages of company's growth. In the initial period the company may have a higher growth rate and the second stage is usually assumed to have a stable growth rate. To begin with, we have to get estimates of the next ten years of cash flows. Where possible we use analyst estimates, but when these aren't available we extrapolate the previous free cash flow (FCF) from the last estimate or reported value. We assume companies with shrinking free cash flow will slow their rate of shrinkage, and that companies with growing free cash flow will see their growth rate slow, over this period. We do this to reflect that growth tends to slow more in the early years than it does in later years.
Generally we assume that a dollar today is more valuable than a dollar in the future, so we discount the value of these future cash flows to their estimated value in today's dollars:
10-year free cash flow (FCF) estimate
| 2024 | 2025 | 2026 | 2027 | 2028 | 2029 | 2030 | 2031 | 2032 | 2033 | |
| Levered FCF (A$, Millions) | AU$2.82b | AU$2.84b | AU$3.57b | AU$3.29b | AU$3.97b | AU$4.25b | AU$4.49b | AU$4.69b | AU$4.87b | AU$5.03b |
| Growth Rate Estimate Source | Analyst x6 | Analyst x6 | Analyst x5 | Analyst x3 | Analyst x2 | Est @ 7.02% | Est @ 5.56% | Est @ 4.54% | Est @ 3.83% | Est @ 3.33% |
| Present Value (A$, Millions) Discounted @ 7.1% | AU$2.6k | AU$2.5k | AU$2.9k | AU$2.5k | AU$2.8k | AU$2.8k | AU$2.8k | AU$2.7k | AU$2.6k | AU$2.5k |
("Est" = FCF growth rate estimated by Simply Wall St)
Present Value of 10-year Cash Flow (PVCF) = AU$27b
The second stage is also known as Terminal Value, this is the business's cash flow after the first stage. The Gordon Growth formula is used to calculate Terminal Value at a future annual growth rate equal to the 5-year average of the 10-year government bond yield of 2.2%. We discount the terminal cash flows to today's value at a cost of equity of 7.1%.
Terminal Value (TV)= FCF2033 × (1 + g) ÷ (r – g) = AU$5.0b× (1 + 2.2%) ÷ (7.1%– 2.2%) = AU$104b
Present Value of Terminal Value (PVTV)= TV / (1 + r)10= AU$104b÷ ( 1 + 7.1%)10= AU$52b
The total value is the sum of cash flows for the next ten years plus the discounted terminal value, which results in the Total Equity Value, which in this case is AU$79b. The last step is to then divide the equity value by the number of shares outstanding. Compared to the current share price of AU$66.7, the company appears about fair value at a 4.6% discount to where the stock price trades currently. The assumptions in any calculation have a big impact on the valuation, so it is better to view this as a rough estimate, not precise down to the last cent.
Important Assumptions
The calculation above is very dependent on two assumptions. The first is the discount rate and the other is the cash flows. Part of investing is coming up with your own evaluation of a company's future performance, so try the calculation yourself and check your own assumptions. The DCF also does not consider the possible cyclicality of an industry, or a company's future capital requirements, so it does not give a full picture of a company's potential performance. Given that we are looking at Wesfarmers as potential shareholders, the cost of equity is used as the discount rate, rather than the cost of capital (or weighted average cost of capital, WACC) which accounts for debt. In this calculation we've used 7.1%, which is based on a levered beta of 1.073. Beta is a measure of a stock's volatility, compared to the market as a whole. We get our beta from the industry average beta of globally comparable companies, with an imposed limit between 0.8 and 2.0, which is a reasonable range for a stable business.
SWOT Analysis for Wesfarmers
- Debt is well covered by earnings and cashflows.
- Dividends are covered by earnings and cash flows.
- Earnings declined over the past year.
- Dividend is low compared to the top 25% of dividend payers in the Multiline Retail market.
- Annual earnings are forecast to grow for the next 3 years.
- Current share price is below our estimate of fair value.
- Annual earnings are forecast to grow slower than the Australian market.
Looking Ahead:
Whilst important, the DCF calculation shouldn't be the only metric you look at when researching a company. The DCF model is not a perfect stock valuation tool. Instead the best use for a DCF model is to test certain assumptions and theories to see if they would lead to the company being undervalued or overvalued. For instance, if the terminal value growth rate is adjusted slightly, it can dramatically alter the overall result. For Wesfarmers, we've compiled three pertinent factors you should consider:
- Risks: To that end, you should be aware of the 2 warning signs we've spotted with Wesfarmers .
- Future Earnings: How does WES's growth rate compare to its peers and the wider market? Dig deeper into the analyst consensus number for the upcoming years by interacting with our free analyst growth expectation chart.
- Other Solid Businesses: Low debt, high returns on equity and good past performance are fundamental to a strong business. Why not explore our interactive list of stocks with solid business fundamentals to see if there are other companies you may not have considered!
PS. The Simply Wall St app conducts a discounted cash flow valuation for every stock on the ASX every day. If you want to find the calculation for other stocks just search here.
Valuation is complex, but we're here to simplify it.
Discover if Wesfarmers might be undervalued or overvalued with our detailed analysis, featuring fair value estimates, potential risks, dividends, insider trades, and its financial condition.
Access Free AnalysisHave feedback on this article? Concerned about the content? Get in touch with us directly. Alternatively, email editorial-team (at) simplywallst.com.
This article by Simply Wall St is general in nature. We provide commentary based on historical data and analyst forecasts only using an unbiased methodology and our articles are not intended to be financial advice. It does not constitute a recommendation to buy or sell any stock, and does not take account of your objectives, or your financial situation. We aim to bring you long-term focused analysis driven by fundamental data. Note that our analysis may not factor in the latest price-sensitive company announcements or qualitative material. Simply Wall St has no position in any stocks mentioned.
About ASX:WES
Wesfarmers
Engages in the retail business in Australia, New Zealand, and internationally.
Solid track record with mediocre balance sheet.
Similar Companies
Market Insights

Community Narratives

