Even though Redbubble (ASX:RBL) has lost AU$43m market cap in last 7 days, shareholders are still up 116% over 5 years


Some Redbubble Limited (ASX:RBL) shareholders are probably rather concerned to see the share price fall 54% over the last three months. But that scarcely detracts from the really solid long term returns generated by the company over five years. In fact, the share price is 115% higher today. So while it's never fun to see a share price fall, it's important to look at a longer time horizon. The more important question is whether the stock is too cheap or too expensive today. Unfortunately not all shareholders will have held it for the long term, so spare a thought for those caught in the 76% decline over the last twelve months.
While the stock has fallen 10% this week, it's worth focusing on the longer term and seeing if the stocks historical returns have been driven by the underlying fundamentals.
View our latest analysis for Redbubble
Redbubble wasn't profitable in the last twelve months, it is unlikely we'll see a strong correlation between its share price and its earnings per share (EPS). Arguably revenue is our next best option. Generally speaking, companies without profits are expected to grow revenue every year, and at a good clip. As you can imagine, fast revenue growth, when maintained, often leads to fast profit growth.
For the last half decade, Redbubble can boast revenue growth at a rate of 32% per year. That's well above most pre-profit companies. Meanwhile, its share price performance certainly reflects the strong growth, given the share price grew at 17% per year, compound, during the period. This suggests the market has well and truly recognized the progress the business has made. Redbubble seems like a high growth stock - so growth investors might want to add it to their watchlist.
The image below shows how earnings and revenue have tracked over time (if you click on the image you can see greater detail).
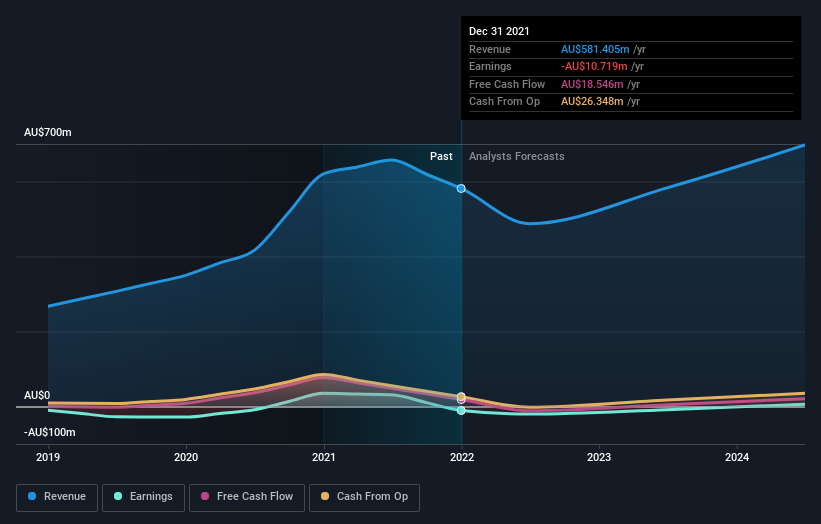
It's probably worth noting we've seen significant insider buying in the last quarter, which we consider a positive. On the other hand, we think the revenue and earnings trends are much more meaningful measures of the business. If you are thinking of buying or selling Redbubble stock, you should check out this free report showing analyst profit forecasts.
A Different Perspective
While the broader market gained around 12% in the last year, Redbubble shareholders lost 76%. However, keep in mind that even the best stocks will sometimes underperform the market over a twelve month period. Longer term investors wouldn't be so upset, since they would have made 17%, each year, over five years. It could be that the recent sell-off is an opportunity, so it may be worth checking the fundamental data for signs of a long term growth trend. It's always interesting to track share price performance over the longer term. But to understand Redbubble better, we need to consider many other factors. Consider risks, for instance. Every company has them, and we've spotted 1 warning sign for Redbubble you should know about.
If you like to buy stocks alongside management, then you might just love this free list of companies. (Hint: insiders have been buying them).
Please note, the market returns quoted in this article reflect the market weighted average returns of stocks that currently trade on AU exchanges.
New: Manage All Your Stock Portfolios in One Place
We've created the ultimate portfolio companion for stock investors, and it's free.
• Connect an unlimited number of Portfolios and see your total in one currency
• Be alerted to new Warning Signs or Risks via email or mobile
• Track the Fair Value of your stocks
Have feedback on this article? Concerned about the content? Get in touch with us directly. Alternatively, email editorial-team (at) simplywallst.com.
This article by Simply Wall St is general in nature. We provide commentary based on historical data and analyst forecasts only using an unbiased methodology and our articles are not intended to be financial advice. It does not constitute a recommendation to buy or sell any stock, and does not take account of your objectives, or your financial situation. We aim to bring you long-term focused analysis driven by fundamental data. Note that our analysis may not factor in the latest price-sensitive company announcements or qualitative material. Simply Wall St has no position in any stocks mentioned.
About ASX:ATG
Articore Group
Operates as an online marketplace that facilitates the sale of art and design products in Australia, the United States, the United Kingdom, and internationally.
Undervalued with excellent balance sheet.
Similar Companies
Market Insights

Community Narratives

