- Australia
- /
- Specialty Stores
- /
- ASX:LOV
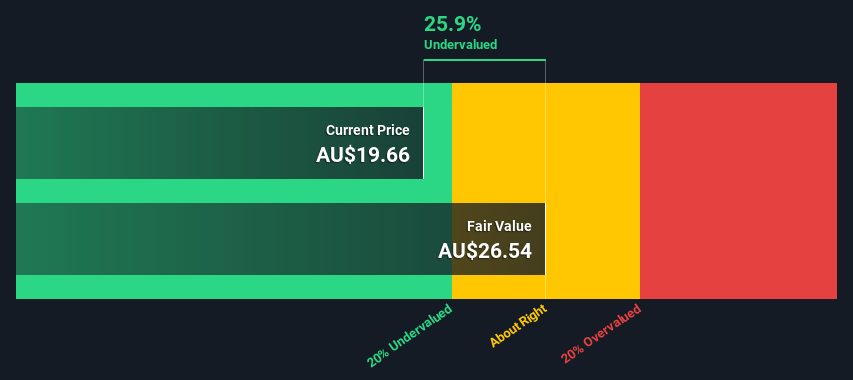
Are Investors Undervaluing Lovisa Holdings Limited (ASX:LOV) By 26%?


Today we will run through one way of estimating the intrinsic value of Lovisa Holdings Limited (ASX:LOV) by taking the expected future cash flows and discounting them to today's value. The Discounted Cash Flow (DCF) model is the tool we will apply to do this. Models like these may appear beyond the comprehension of a lay person, but they're fairly easy to follow.
Remember though, that there are many ways to estimate a company's value, and a DCF is just one method. For those who are keen learners of equity analysis, the Simply Wall St analysis model here may be something of interest to you.
View our latest analysis for Lovisa Holdings
Step by step through the calculation
We're using the 2-stage growth model, which simply means we take in account two stages of company's growth. In the initial period the company may have a higher growth rate and the second stage is usually assumed to have a stable growth rate. To start off with, we need to estimate the next ten years of cash flows. Where possible we use analyst estimates, but when these aren't available we extrapolate the previous free cash flow (FCF) from the last estimate or reported value. We assume companies with shrinking free cash flow will slow their rate of shrinkage, and that companies with growing free cash flow will see their growth rate slow, over this period. We do this to reflect that growth tends to slow more in the early years than it does in later years.
Generally we assume that a dollar today is more valuable than a dollar in the future, so we need to discount the sum of these future cash flows to arrive at a present value estimate:
10-year free cash flow (FCF) estimate
| 2022 | 2023 | 2024 | 2025 | 2026 | 2027 | 2028 | 2029 | 2030 | 2031 | |
| Levered FCF (A$, Millions) | AU$73.4m | AU$82.0m | AU$108.6m | AU$130.2m | AU$146.1m | AU$159.4m | AU$170.4m | AU$179.6m | AU$187.4m | AU$194.2m |
| Growth Rate Estimate Source | Analyst x5 | Analyst x5 | Analyst x3 | Analyst x1 | Est @ 12.2% | Est @ 9.1% | Est @ 6.93% | Est @ 5.41% | Est @ 4.34% | Est @ 3.6% |
| Present Value (A$, Millions) Discounted @ 7.1% | AU$68.6 | AU$71.5 | AU$88.5 | AU$99.0 | AU$104 | AU$106 | AU$106 | AU$104 | AU$101 | AU$97.9 |
("Est" = FCF growth rate estimated by Simply Wall St)
Present Value of 10-year Cash Flow (PVCF) = AU$945m
The second stage is also known as Terminal Value, this is the business's cash flow after the first stage. The Gordon Growth formula is used to calculate Terminal Value at a future annual growth rate equal to the 5-year average of the 10-year government bond yield of 1.9%. We discount the terminal cash flows to today's value at a cost of equity of 7.1%.
Terminal Value (TV)= FCF2031 × (1 + g) ÷ (r – g) = AU$194m× (1 + 1.9%) ÷ (7.1%– 1.9%) = AU$3.8b
Present Value of Terminal Value (PVTV)= TV / (1 + r)10= AU$3.8b÷ ( 1 + 7.1%)10= AU$1.9b
The total value, or equity value, is then the sum of the present value of the future cash flows, which in this case is AU$2.9b. To get the intrinsic value per share, we divide this by the total number of shares outstanding. Relative to the current share price of AU$19.7, the company appears a touch undervalued at a 26% discount to where the stock price trades currently. Valuations are imprecise instruments though, rather like a telescope - move a few degrees and end up in a different galaxy. Do keep this in mind.
Important assumptions
Now the most important inputs to a discounted cash flow are the discount rate, and of course, the actual cash flows. If you don't agree with these result, have a go at the calculation yourself and play with the assumptions. The DCF also does not consider the possible cyclicality of an industry, or a company's future capital requirements, so it does not give a full picture of a company's potential performance. Given that we are looking at Lovisa Holdings as potential shareholders, the cost of equity is used as the discount rate, rather than the cost of capital (or weighted average cost of capital, WACC) which accounts for debt. In this calculation we've used 7.1%, which is based on a levered beta of 1.194. Beta is a measure of a stock's volatility, compared to the market as a whole. We get our beta from the industry average beta of globally comparable companies, with an imposed limit between 0.8 and 2.0, which is a reasonable range for a stable business.
Looking Ahead:
Whilst important, the DCF calculation is only one of many factors that you need to assess for a company. The DCF model is not a perfect stock valuation tool. Instead the best use for a DCF model is to test certain assumptions and theories to see if they would lead to the company being undervalued or overvalued. For instance, if the terminal value growth rate is adjusted slightly, it can dramatically alter the overall result. Why is the intrinsic value higher than the current share price? For Lovisa Holdings, there are three relevant items you should consider:
- Risks: Case in point, we've spotted 1 warning sign for Lovisa Holdings you should be aware of.
- Management:Have insiders been ramping up their shares to take advantage of the market's sentiment for LOV's future outlook? Check out our management and board analysis with insights on CEO compensation and governance factors.
- Other High Quality Alternatives: Do you like a good all-rounder? Explore our interactive list of high quality stocks to get an idea of what else is out there you may be missing!
PS. Simply Wall St updates its DCF calculation for every Australian stock every day, so if you want to find the intrinsic value of any other stock just search here.
New: AI Stock Screener & Alerts
Our new AI Stock Screener scans the market every day to uncover opportunities.
• Dividend Powerhouses (3%+ Yield)
• Undervalued Small Caps with Insider Buying
• High growth Tech and AI Companies
Or build your own from over 50 metrics.
Have feedback on this article? Concerned about the content? Get in touch with us directly. Alternatively, email editorial-team (at) simplywallst.com.
This article by Simply Wall St is general in nature. We provide commentary based on historical data and analyst forecasts only using an unbiased methodology and our articles are not intended to be financial advice. It does not constitute a recommendation to buy or sell any stock, and does not take account of your objectives, or your financial situation. We aim to bring you long-term focused analysis driven by fundamental data. Note that our analysis may not factor in the latest price-sensitive company announcements or qualitative material. Simply Wall St has no position in any stocks mentioned.
About ASX:LOV
Lovisa Holdings
Engages in the retail sale of fashion jewelry and accessories.
Solid track record with reasonable growth potential.
Market Insights

Community Narratives
