- Australia
- /
- Specialty Stores
- /
- ASX:CCX
Risks Still Elevated At These Prices As City Chic Collective Limited (ASX:CCX) Shares Dive 28%


The City Chic Collective Limited (ASX:CCX) share price has softened a substantial 28% over the previous 30 days, handing back much of the gains the stock has made lately. The drop over the last 30 days has capped off a tough year for shareholders, with the share price down 15% in that time.
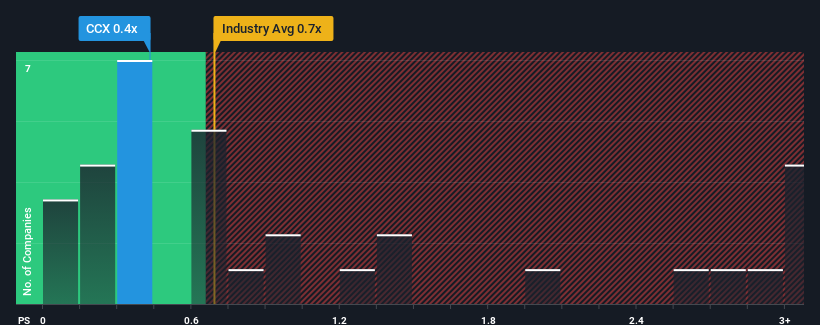
In spite of the heavy fall in price, it's still not a stretch to say that City Chic Collective's price-to-sales (or "P/S") ratio of 0.4x right now seems quite "middle-of-the-road" compared to the Specialty Retail industry in Australia, where the median P/S ratio is around 0.7x. However, investors might be overlooking a clear opportunity or potential setback if there is no rational basis for the P/S.
Check out our latest analysis for City Chic Collective
What Does City Chic Collective's Recent Performance Look Like?
City Chic Collective hasn't been tracking well recently as its declining revenue compares poorly to other companies, which have seen some growth in their revenues on average. It might be that many expect the dour revenue performance to strengthen positively, which has kept the P/S from falling. However, if this isn't the case, investors might get caught out paying too much for the stock.
Want the full picture on analyst estimates for the company? Then our free report on City Chic Collective will help you uncover what's on the horizon.Do Revenue Forecasts Match The P/S Ratio?
City Chic Collective's P/S ratio would be typical for a company that's only expected to deliver moderate growth, and importantly, perform in line with the industry.
In reviewing the last year of financials, we were disheartened to see the company's revenues fell to the tune of 23%. That put a dampener on the good run it was having over the longer-term as its three-year revenue growth is still a noteworthy 7.1% in total. Accordingly, while they would have preferred to keep the run going, shareholders would be roughly satisfied with the medium-term rates of revenue growth.
Looking ahead now, revenue is anticipated to slump, contracting by 4.6% during the coming year according to the eight analysts following the company. With the industry predicted to deliver 9.2% growth, that's a disappointing outcome.
In light of this, it's somewhat alarming that City Chic Collective's P/S sits in line with the majority of other companies. Apparently many investors in the company reject the analyst cohort's pessimism and aren't willing to let go of their stock right now. There's a good chance these shareholders are setting themselves up for future disappointment if the P/S falls to levels more in line with the negative growth outlook.
What Does City Chic Collective's P/S Mean For Investors?
Following City Chic Collective's share price tumble, its P/S is just clinging on to the industry median P/S. Using the price-to-sales ratio alone to determine if you should sell your stock isn't sensible, however it can be a practical guide to the company's future prospects.
While City Chic Collective's P/S isn't anything out of the ordinary for companies in the industry, we didn't expect it given forecasts of revenue decline. When we see a gloomy outlook like this, our immediate thoughts are that the share price is at risk of declining, negatively impacting P/S. If we consider the revenue outlook, the P/S seems to indicate that potential investors may be paying a premium for the stock.
There are also other vital risk factors to consider before investing and we've discovered 1 warning sign for City Chic Collective that you should be aware of.
If these risks are making you reconsider your opinion on City Chic Collective, explore our interactive list of high quality stocks to get an idea of what else is out there.
New: AI Stock Screener & Alerts
Our new AI Stock Screener scans the market every day to uncover opportunities.
• Dividend Powerhouses (3%+ Yield)
• Undervalued Small Caps with Insider Buying
• High growth Tech and AI Companies
Or build your own from over 50 metrics.
Have feedback on this article? Concerned about the content? Get in touch with us directly. Alternatively, email editorial-team (at) simplywallst.com.
This article by Simply Wall St is general in nature. We provide commentary based on historical data and analyst forecasts only using an unbiased methodology and our articles are not intended to be financial advice. It does not constitute a recommendation to buy or sell any stock, and does not take account of your objectives, or your financial situation. We aim to bring you long-term focused analysis driven by fundamental data. Note that our analysis may not factor in the latest price-sensitive company announcements or qualitative material. Simply Wall St has no position in any stocks mentioned.
About ASX:CCX
City Chic Collective
Operates as a retailer of plus-size women’s apparel, footwear, and accessories in Australia, New Zealand, and the United States.
Flawless balance sheet and undervalued.
Similar Companies
Market Insights

Community Narratives

