- Australia
- /
- Real Estate
- /
- ASX:UOS
United Overseas Australia (ASX:UOS) Has Compensated Shareholders With A Respectable 96% Return On Their Investment


When we invest, we're generally looking for stocks that outperform the market average. And the truth is, you can make significant gains if you buy good quality businesses at the right price. For example, the United Overseas Australia Limited (ASX:UOS) share price is up 57% in the last 5 years, clearly besting the market return of around 35% (ignoring dividends).
Check out our latest analysis for United Overseas Australia
While markets are a powerful pricing mechanism, share prices reflect investor sentiment, not just underlying business performance. One imperfect but simple way to consider how the market perception of a company has shifted is to compare the change in the earnings per share (EPS) with the share price movement.
During five years of share price growth, United Overseas Australia actually saw its EPS drop 10% per year.
This means it's unlikely the market is judging the company based on earnings growth. Because earnings per share don't seem to match up with the share price, we'll take a look at other metrics instead.
It is not great to see that revenue has dropped by 4.5% per year over five years. So it seems one might have to take closer look at earnings and revenue trends to see how they might influence the share price.
The image below shows how earnings and revenue have tracked over time (if you click on the image you can see greater detail).
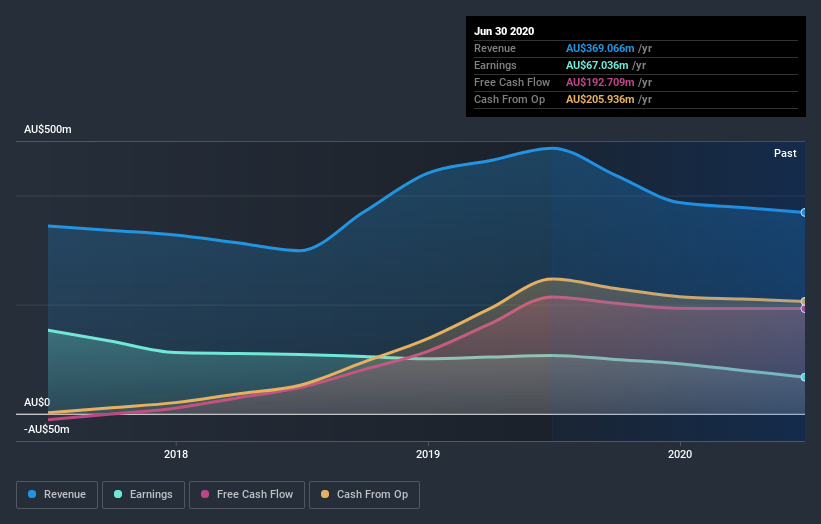
We consider it positive that insiders have made significant purchases in the last year. Having said that, most people consider earnings and revenue growth trends to be a more meaningful guide to the business. Before buying or selling a stock, we always recommend a close examination of historic growth trends, available here..
What about the Total Shareholder Return (TSR)?
We'd be remiss not to mention the difference between United Overseas Australia's total shareholder return (TSR) and its share price return. The TSR attempts to capture the value of dividends (as if they were reinvested) as well as any spin-offs or discounted capital raisings offered to shareholders. Its history of dividend payouts mean that United Overseas Australia's TSR of 96% over the last 5 years is better than the share price return.
A Different Perspective
Investors in United Overseas Australia had a tough year, with a total loss of 7.1%, against a market gain of about 4.9%. Even the share prices of good stocks drop sometimes, but we want to see improvements in the fundamental metrics of a business, before getting too interested. On the bright side, long term shareholders have made money, with a gain of 14% per year over half a decade. It could be that the recent sell-off is an opportunity, so it may be worth checking the fundamental data for signs of a long term growth trend. While it is well worth considering the different impacts that market conditions can have on the share price, there are other factors that are even more important. For instance, we've identified 1 warning sign for United Overseas Australia that you should be aware of.
United Overseas Australia is not the only stock insiders are buying. So take a peek at this free list of growing companies with insider buying.
Please note, the market returns quoted in this article reflect the market weighted average returns of stocks that currently trade on AU exchanges.
If you’re looking to trade United Overseas Australia, open an account with the lowest-cost* platform trusted by professionals, Interactive Brokers. Their clients from over 200 countries and territories trade stocks, options, futures, forex, bonds and funds worldwide from a single integrated account. Promoted
New: AI Stock Screener & Alerts
Our new AI Stock Screener scans the market every day to uncover opportunities.
• Dividend Powerhouses (3%+ Yield)
• Undervalued Small Caps with Insider Buying
• High growth Tech and AI Companies
Or build your own from over 50 metrics.
This article by Simply Wall St is general in nature. It does not constitute a recommendation to buy or sell any stock, and does not take account of your objectives, or your financial situation. We aim to bring you long-term focused analysis driven by fundamental data. Note that our analysis may not factor in the latest price-sensitive company announcements or qualitative material. Simply Wall St has no position in any stocks mentioned.
*Interactive Brokers Rated Lowest Cost Broker by StockBrokers.com Annual Online Review 2020
Have feedback on this article? Concerned about the content? Get in touch with us directly. Alternatively, email editorial-team (at) simplywallst.com.
About ASX:UOS
United Overseas Australia
Engages in the development and resale of land and buildings in Malaysia, Singapore, Vietnam, and Australia.
Excellent balance sheet with acceptable track record.
Similar Companies
Market Insights

Community Narratives

