Stockland (ASX:SGP) shareholders have earned a 49% return over the last year


The simplest way to invest in stocks is to buy exchange traded funds. But investors can boost returns by picking market-beating companies to own shares in. For example, the Stockland (ASX:SGP) share price is up 41% in the last 1 year, clearly besting the market return of around 18% (not including dividends). That's a solid performance by our standards! Having said that, the longer term returns aren't so impressive, with stock gaining just 19% in three years.
Let's take a look at the underlying fundamentals over the longer term, and see if they've been consistent with shareholders returns.
Check out our latest analysis for Stockland
To paraphrase Benjamin Graham: Over the short term the market is a voting machine, but over the long term it's a weighing machine. One way to examine how market sentiment has changed over time is to look at the interaction between a company's share price and its earnings per share (EPS).
Over the last twelve months, Stockland actually shrank its EPS by 30%.
Given the share price gain, we doubt the market is measuring progress with EPS. Since the change in EPS doesn't seem to correlate with the change in share price, it's worth taking a look at other metrics.
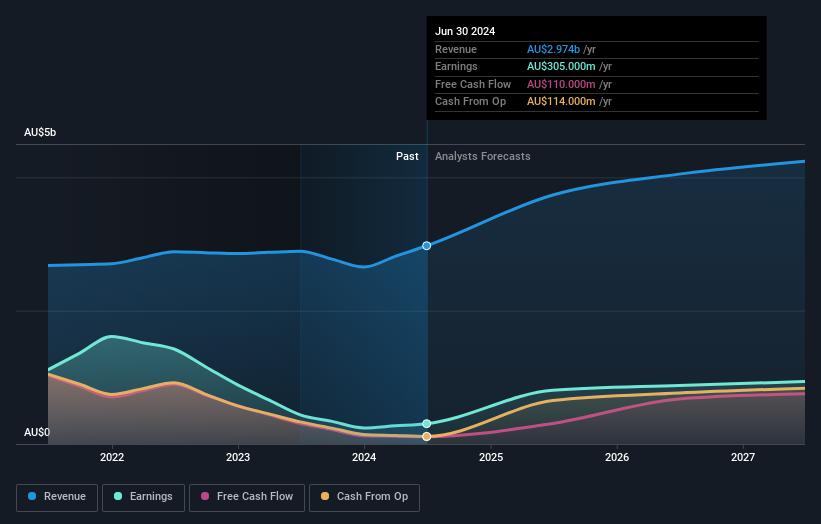
We haven't seen Stockland increase dividend payments yet, so the yield probably hasn't helped drive the share higher. And at a glance the revenue growth does not impress, though a closer look at revenue trends may reveal some form of insight.
The company's revenue and earnings (over time) are depicted in the image below (click to see the exact numbers).
Stockland is well known by investors, and plenty of clever analysts have tried to predict the future profit levels. If you are thinking of buying or selling Stockland stock, you should check out this free report showing analyst consensus estimates for future profits.
What About Dividends?
When looking at investment returns, it is important to consider the difference between total shareholder return (TSR) and share price return. The TSR is a return calculation that accounts for the value of cash dividends (assuming that any dividend received was reinvested) and the calculated value of any discounted capital raisings and spin-offs. So for companies that pay a generous dividend, the TSR is often a lot higher than the share price return. We note that for Stockland the TSR over the last 1 year was 49%, which is better than the share price return mentioned above. And there's no prize for guessing that the dividend payments largely explain the divergence!
A Different Perspective
We're pleased to report that Stockland shareholders have received a total shareholder return of 49% over one year. That's including the dividend. That gain is better than the annual TSR over five years, which is 9%. Therefore it seems like sentiment around the company has been positive lately. In the best case scenario, this may hint at some real business momentum, implying that now could be a great time to delve deeper. I find it very interesting to look at share price over the long term as a proxy for business performance. But to truly gain insight, we need to consider other information, too. Take risks, for example - Stockland has 4 warning signs (and 1 which shouldn't be ignored) we think you should know about.
But note: Stockland may not be the best stock to buy. So take a peek at this free list of interesting companies with past earnings growth (and further growth forecast).
Please note, the market returns quoted in this article reflect the market weighted average returns of stocks that currently trade on Australian exchanges.
New: Manage All Your Stock Portfolios in One Place
We've created the ultimate portfolio companion for stock investors, and it's free.
• Connect an unlimited number of Portfolios and see your total in one currency
• Be alerted to new Warning Signs or Risks via email or mobile
• Track the Fair Value of your stocks
Have feedback on this article? Concerned about the content? Get in touch with us directly. Alternatively, email editorial-team (at) simplywallst.com.
This article by Simply Wall St is general in nature. We provide commentary based on historical data and analyst forecasts only using an unbiased methodology and our articles are not intended to be financial advice. It does not constitute a recommendation to buy or sell any stock, and does not take account of your objectives, or your financial situation. We aim to bring you long-term focused analysis driven by fundamental data. Note that our analysis may not factor in the latest price-sensitive company announcements or qualitative material. Simply Wall St has no position in any stocks mentioned.
About ASX:SGP
Stockland
We are a leading creator and curator of connected communities with people at the heart of the places we create.
Solid track record with moderate growth potential.
Similar Companies
Market Insights


Community Narratives


