
Want to participate in a short research study? Help shape the future of investing tools and you could win a $250 gift card!
Dexus is a AU$15b large-cap, real estate investment trust (REIT) based in Sydney, Australia. REITs own and operate income-generating property and adhere to a different set of regulations. This impacts how DXS’s business operates and also how we should analyse its stock. In this commentary, I'll take you through some of the things I look at when assessing DXS.
View our latest analysis for Dexus
Funds from Operations (FFO) is a higher quality measure of DXS's earnings compared to net income. This term is very common in the REIT investing world as it provides a cleaner look at its cash flow from daily operations by excluding impact of one-off activities or non-cash items such as depreciation. For DXS, its FFO of AU$610m makes up 53% of its gross profit, which means over a third of its earnings are high-quality and recurring.
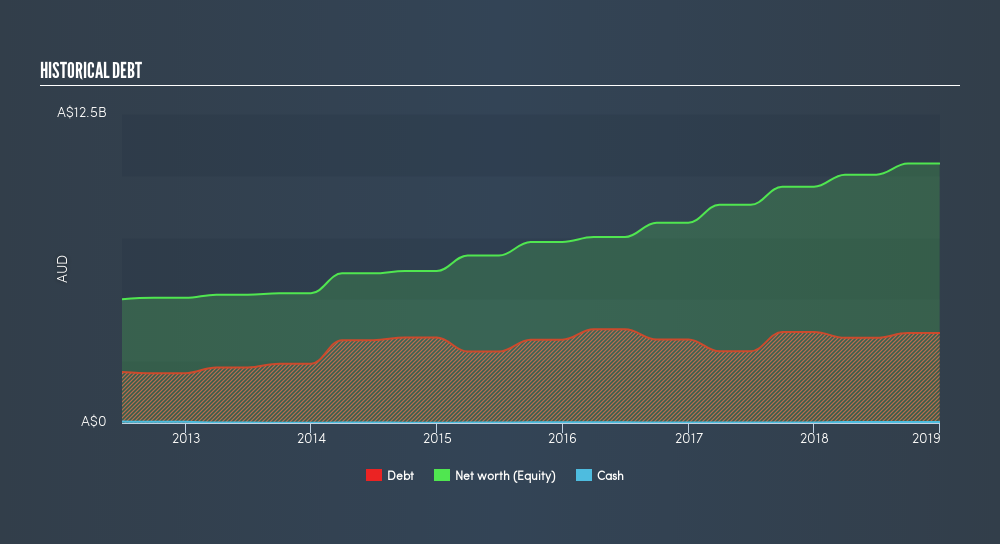
In order to understand whether DXS has a healthy balance sheet, we have to look at a metric called FFO-to-total debt. This tells us how long it will take DXS to pay off its debt using its income from its main business activities, and gives us an insight into DXS’s ability to service its borrowings. With a ratio of 18%, the credit rating agency Standard & Poor would consider this as significantly high risk. This would take DXS 5.65 years to pay off using operating income alone. Given that long-term debt is a multi-year commitment this is not unusual, however, the longer it takes for a company to pay back debt, the higher the risk associated with that company.
Next, interest coverage ratio shows how many times DXS’s earnings can cover its annual interest payments. Usually the ratio is calculated using EBIT, but for REITs, it’s better to use FFO divided by net interest. This is similar to the above concept, but looks at the nearer-term obligations. With an interest coverage ratio of 4.99x, it’s safe to say DXS is generating an appropriate amount of cash from its borrowings.
I also use FFO to look at DXS's valuation relative to other REITs in Australia by using the price-to-FFO metric. This is conceptually the same as the price-to-earnings (PE) ratio, but as previously mentioned, FFO is more suitable. In DXS’s case its P/FFO is 24.54x, compared to the long-term industry average of 16.5x, meaning that it is overvalued.
Next Steps:
As a REIT, Dexus offers some unique characteristics which could help diversify your portfolio. However, before you decide on whether or not to invest in DXS, I highly recommend taking a look at other aspects of the stock to consider:
- Future Outlook: What are well-informed industry analysts predicting for DXS’s future growth? Take a look at our free research report of analyst consensus for DXS’s outlook.
- Valuation: What is DXS worth today? Is the stock undervalued, even when its growth outlook is factored into its intrinsic value? The intrinsic value infographic in our free research report helps visualize whether DXS is currently mispriced by the market.
- Other High-Performing Stocks: Are there other stocks that provide better prospects with proven track records? Explore our free list of these great stocks here.
We aim to bring you long-term focused research analysis driven by fundamental data. Note that our analysis may not factor in the latest price-sensitive company announcements or qualitative material.
If you spot an error that warrants correction, please contact the editor at editorial-team@simplywallst.com. This article by Simply Wall St is general in nature. It does not constitute a recommendation to buy or sell any stock, and does not take account of your objectives, or your financial situation. Simply Wall St has no position in the stocks mentioned. Thank you for reading.
About ASX:DXS
DEXUS
Dexus (ASX: DXS) is a leading Australasian fully integrated real asset group, managing a high-quality Australasian real estate and infrastructure portfolio valued at $50.1 billion.
Average dividend payer and fair value.
Similar Companies
Market Insights

Weekly Picks

Early mover in a fast growing industry. Likely to experience share price volatility as they scale


A case for CA$31.80 (undiluted), aka 8,616% upside from CA$0.37 (an 86 bagger!).


Moderation and Stabilisation: HOLD: Fair Price based on a 4-year Cycle is $12.08
Recently Updated Narratives

Amazon: Why the World’s Biggest Platform Still Runs on Invisible Economics

Sunrun Stock: When the Energy Transition Collides With the Cost of Capital

Salesforce Stock: AI-Fueled Growth Is Real — But Can Margins Stay This Strong?
Popular Narratives


MicroVision will explode future revenue by 380.37% with a vision towards success


Crazy Undervalued 42 Baggers Silver Play (Active & Running Mine)


