Improved Revenues Required Before Syntara Limited (ASX:SNT) Stock's 36% Jump Looks Justified


Syntara Limited (ASX:SNT) shares have continued their recent momentum with a 36% gain in the last month alone. Not all shareholders will be feeling jubilant, since the share price is still down a very disappointing 41% in the last twelve months.
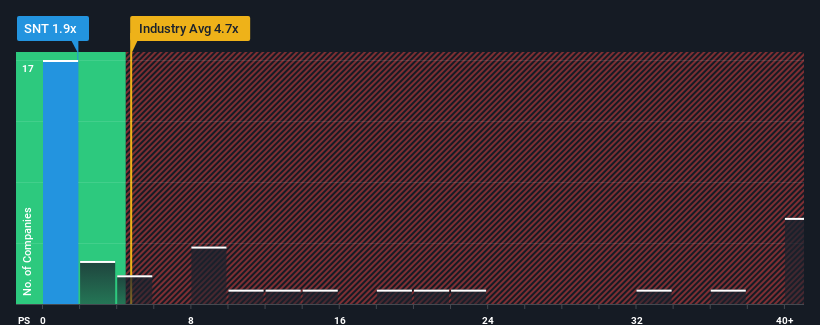
In spite of the firm bounce in price, Syntara's price-to-sales (or "P/S") ratio of 1.9x might still make it look like a strong buy right now compared to the wider Pharmaceuticals industry in Australia, where around half of the companies have P/S ratios above 4.7x and even P/S above 22x are quite common. Although, it's not wise to just take the P/S at face value as there may be an explanation why it's so limited.
See our latest analysis for Syntara
What Does Syntara's Recent Performance Look Like?
Recent times haven't been great for Syntara as its revenue has been rising slower than most other companies. The P/S ratio is probably low because investors think this lacklustre revenue performance isn't going to get any better. If this is the case, then existing shareholders will probably struggle to get excited about the future direction of the share price.
Want the full picture on analyst estimates for the company? Then our free report on Syntara will help you uncover what's on the horizon.Is There Any Revenue Growth Forecasted For Syntara?
The only time you'd be truly comfortable seeing a P/S as depressed as Syntara's is when the company's growth is on track to lag the industry decidedly.
Retrospectively, the last year delivered a decent 5.3% gain to the company's revenues. Ultimately though, it couldn't turn around the poor performance of the prior period, with revenue shrinking 29% in total over the last three years. Therefore, it's fair to say the revenue growth recently has been undesirable for the company.
Shifting to the future, estimates from the sole analyst covering the company suggest revenue growth is heading into negative territory, declining 71% over the next year. With the industry predicted to deliver 413,395% growth, that's a disappointing outcome.
In light of this, it's understandable that Syntara's P/S would sit below the majority of other companies. Nonetheless, there's no guarantee the P/S has reached a floor yet with revenue going in reverse. There's potential for the P/S to fall to even lower levels if the company doesn't improve its top-line growth.
The Bottom Line On Syntara's P/S
Even after such a strong price move, Syntara's P/S still trails the rest of the industry. Typically, we'd caution against reading too much into price-to-sales ratios when settling on investment decisions, though it can reveal plenty about what other market participants think about the company.
It's clear to see that Syntara maintains its low P/S on the weakness of its forecast for sliding revenue, as expected. At this stage investors feel the potential for an improvement in revenue isn't great enough to justify a higher P/S ratio. Unless these conditions improve, they will continue to form a barrier for the share price around these levels.
Plus, you should also learn about these 5 warning signs we've spotted with Syntara (including 3 which are a bit concerning).
If companies with solid past earnings growth is up your alley, you may wish to see this free collection of other companies with strong earnings growth and low P/E ratios.
New: Manage All Your Stock Portfolios in One Place
We've created the ultimate portfolio companion for stock investors, and it's free.
• Connect an unlimited number of Portfolios and see your total in one currency
• Be alerted to new Warning Signs or Risks via email or mobile
• Track the Fair Value of your stocks
Have feedback on this article? Concerned about the content? Get in touch with us directly. Alternatively, email editorial-team (at) simplywallst.com.
This article by Simply Wall St is general in nature. We provide commentary based on historical data and analyst forecasts only using an unbiased methodology and our articles are not intended to be financial advice. It does not constitute a recommendation to buy or sell any stock, and does not take account of your objectives, or your financial situation. We aim to bring you long-term focused analysis driven by fundamental data. Note that our analysis may not factor in the latest price-sensitive company announcements or qualitative material. Simply Wall St has no position in any stocks mentioned.
Have feedback on this article? Concerned about the content? Get in touch with us directly. Alternatively, email editorial-team@simplywallst.com
About ASX:SNT
Syntara
Operates as a clinical-stage drug development company that focuses on blood-related cancers in Australia.
Excellent balance sheet moderate.
Market Insights

Community Narratives
