SEEK (ASX:SEK investor three-year losses grow to 33% as the stock sheds AU$392m this past week


Many investors define successful investing as beating the market average over the long term. But if you try your hand at stock picking, you risk returning less than the market. Unfortunately, that's been the case for longer term SEEK Limited (ASX:SEK) shareholders, since the share price is down 37% in the last three years, falling well short of the market return of around 19%. Furthermore, it's down 16% in about a quarter. That's not much fun for holders.
Since SEEK has shed AU$392m from its value in the past 7 days, let's see if the longer term decline has been driven by the business' economics.
See our latest analysis for SEEK
To quote Buffett, 'Ships will sail around the world but the Flat Earth Society will flourish. There will continue to be wide discrepancies between price and value in the marketplace...' By comparing earnings per share (EPS) and share price changes over time, we can get a feel for how investor attitudes to a company have morphed over time.
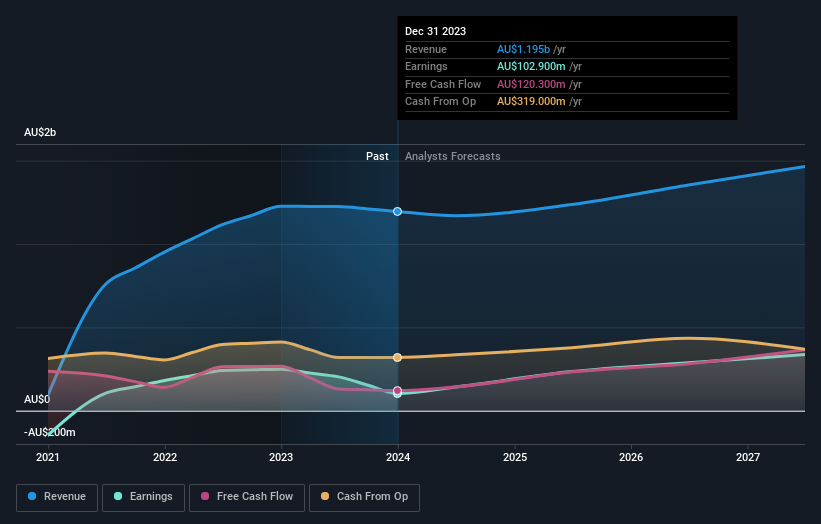
During five years of share price growth, SEEK moved from a loss to profitability. That would generally be considered a positive, so we are surprised to see the share price is down. So it's worth looking at other metrics to try to understand the share price move.
We note that, in three years, revenue has actually grown at a 29% annual rate, so that doesn't seem to be a reason to sell shares. This analysis is just perfunctory, but it might be worth researching SEEK more closely, as sometimes stocks fall unfairly. This could present an opportunity.
The image below shows how earnings and revenue have tracked over time (if you click on the image you can see greater detail).
SEEK is a well known stock, with plenty of analyst coverage, suggesting some visibility into future growth. So it makes a lot of sense to check out what analysts think SEEK will earn in the future (free analyst consensus estimates)
What About Dividends?
It is important to consider the total shareholder return, as well as the share price return, for any given stock. Whereas the share price return only reflects the change in the share price, the TSR includes the value of dividends (assuming they were reinvested) and the benefit of any discounted capital raising or spin-off. Arguably, the TSR gives a more comprehensive picture of the return generated by a stock. In the case of SEEK, it has a TSR of -33% for the last 3 years. That exceeds its share price return that we previously mentioned. And there's no prize for guessing that the dividend payments largely explain the divergence!
A Different Perspective
SEEK shareholders are down 7.3% for the year (even including dividends), but the market itself is up 14%. However, keep in mind that even the best stocks will sometimes underperform the market over a twelve month period. Unfortunately, last year's performance may indicate unresolved challenges, given that it was worse than the annualised loss of 0.1% over the last half decade. We realise that Baron Rothschild has said investors should "buy when there is blood on the streets", but we caution that investors should first be sure they are buying a high quality business. I find it very interesting to look at share price over the long term as a proxy for business performance. But to truly gain insight, we need to consider other information, too. For example, we've discovered 2 warning signs for SEEK that you should be aware of before investing here.
But note: SEEK may not be the best stock to buy. So take a peek at this free list of interesting companies with past earnings growth (and further growth forecast).
Please note, the market returns quoted in this article reflect the market weighted average returns of stocks that currently trade on Australian exchanges.
New: Manage All Your Stock Portfolios in One Place
We've created the ultimate portfolio companion for stock investors, and it's free.
• Connect an unlimited number of Portfolios and see your total in one currency
• Be alerted to new Warning Signs or Risks via email or mobile
• Track the Fair Value of your stocks
Have feedback on this article? Concerned about the content? Get in touch with us directly. Alternatively, email editorial-team (at) simplywallst.com.
This article by Simply Wall St is general in nature. We provide commentary based on historical data and analyst forecasts only using an unbiased methodology and our articles are not intended to be financial advice. It does not constitute a recommendation to buy or sell any stock, and does not take account of your objectives, or your financial situation. We aim to bring you long-term focused analysis driven by fundamental data. Note that our analysis may not factor in the latest price-sensitive company announcements or qualitative material. Simply Wall St has no position in any stocks mentioned.
Have feedback on this article? Concerned about the content? Get in touch with us directly. Alternatively, email editorial-team@simplywallst.com
About ASX:SEK
SEEK
Engages in the provision of online employment marketplace services in Australia, South East Asia, New Zealand, the United Kingdom, Europe, and internationally.
Reasonable growth potential with adequate balance sheet.

