
Advertisement
We're Hopeful That RMA Global (ASX:RMY) Will Use Its Cash Wisely

We can readily understand why investors are attracted to unprofitable companies. For example, although Amazon.com made losses for many years after listing, if you had bought and held the shares since 1999, you would have made a fortune. Nonetheless, only a fool would ignore the risk that a loss making company burns through its cash too quickly.
Given this risk, we thought we'd take a look at whether RMA Global (ASX:RMY) shareholders should be worried about its cash burn. In this report, we will consider the company's annual negative free cash flow, henceforth referring to it as the 'cash burn'. We'll start by comparing its cash burn with its cash reserves in order to calculate its cash runway.
View our latest analysis for RMA Global
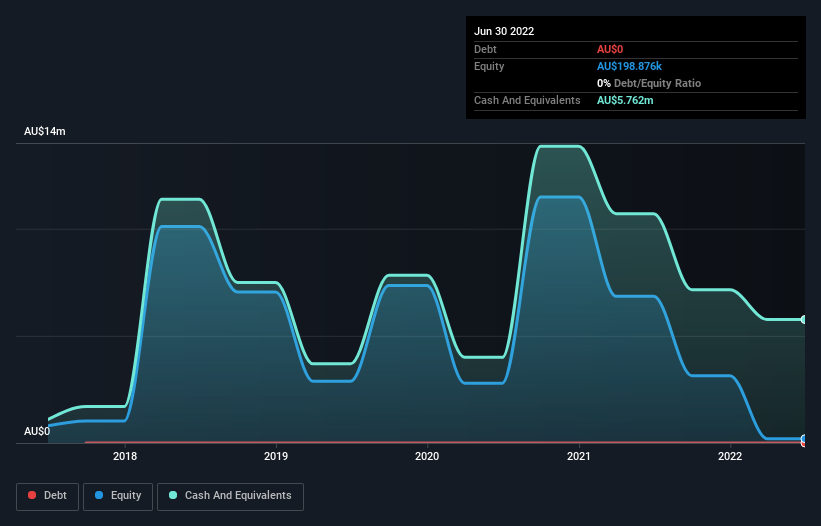
How Long Is RMA Global's Cash Runway?
A company's cash runway is calculated by dividing its cash hoard by its cash burn. In June 2022, RMA Global had AU$5.8m in cash, and was debt-free. Importantly, its cash burn was AU$4.6m over the trailing twelve months. That means it had a cash runway of around 15 months as of June 2022. While that cash runway isn't too concerning, sensible holders would be peering into the distance, and considering what happens if the company runs out of cash. You can see how its cash balance has changed over time in the image below.
How Well Is RMA Global Growing?
RMA Global reduced its cash burn by 20% during the last year, which points to some degree of discipline. On top of that, operating revenue was up 38%, making for a heartening combination We think it is growing rather well, upon reflection. In reality, this article only makes a short study of the company's growth data. You can take a look at how RMA Global is growing revenue over time by checking this visualization of past revenue growth.
How Easily Can RMA Global Raise Cash?
Even though it seems like RMA Global is developing its business nicely, we still like to consider how easily it could raise more money to accelerate growth. Issuing new shares, or taking on debt, are the most common ways for a listed company to raise more money for its business. Many companies end up issuing new shares to fund future growth. We can compare a company's cash burn to its market capitalisation to get a sense for how many new shares a company would have to issue to fund one year's operations.
Since it has a market capitalisation of AU$79m, RMA Global's AU$4.6m in cash burn equates to about 5.8% of its market value. Given that is a rather small percentage, it would probably be really easy for the company to fund another year's growth by issuing some new shares to investors, or even by taking out a loan.
How Risky Is RMA Global's Cash Burn Situation?
The good news is that in our view RMA Global's cash burn situation gives shareholders real reason for optimism. Not only was its cash burn relative to its market cap quite good, but its revenue growth was a real positive. Based on the factors mentioned in this article, we think its cash burn situation warrants some attention from shareholders, but we don't think they should be worried. On another note, we conducted an in-depth investigation of the company, and identified 3 warning signs for RMA Global (2 can't be ignored!) that you should be aware of before investing here.
Of course RMA Global may not be the best stock to buy. So you may wish to see this free collection of companies boasting high return on equity, or this list of stocks that insiders are buying.
New: AI Stock Screener & Alerts
Our new AI Stock Screener scans the market every day to uncover opportunities.
• Dividend Powerhouses (3%+ Yield)
• Undervalued Small Caps with Insider Buying
• High growth Tech and AI Companies
Or build your own from over 50 metrics.
Have feedback on this article? Concerned about the content? Get in touch with us directly. Alternatively, email editorial-team (at) simplywallst.com.
This article by Simply Wall St is general in nature. We provide commentary based on historical data and analyst forecasts only using an unbiased methodology and our articles are not intended to be financial advice. It does not constitute a recommendation to buy or sell any stock, and does not take account of your objectives, or your financial situation. We aim to bring you long-term focused analysis driven by fundamental data. Note that our analysis may not factor in the latest price-sensitive company announcements or qualitative material. Simply Wall St has no position in any stocks mentioned.
About ASX:RMY
RMA Global
An online digital marketing company, provides data on real estate in Australia, New Zealand, and the United States.
High growth potential with excellent balance sheet.
Market Insights

Advertisement
Community Narratives
WhiteCap Is Positioned To Profit Regardless Of Trump's Policy 
Fair Value CA$22.60|61.7% undervalued
ST
Equity Analyst and Writer
Microsoft's Evolution Will Drive Revenue to New Heights Fueled by AI
Fair Value US$360.00|28.9% overvalued
BR
Community Contributor
A CASE FOR USD$2.50 (CAD$3.44) BY 2028 (A 5-10 BAGGER)
Fair Value CA$3.44|88.1% undervalued
AG
Community Contributor