
Advertisement
Is REA Group Limited (ASX:REA) Worth AU$216 Based On Its Intrinsic Value?
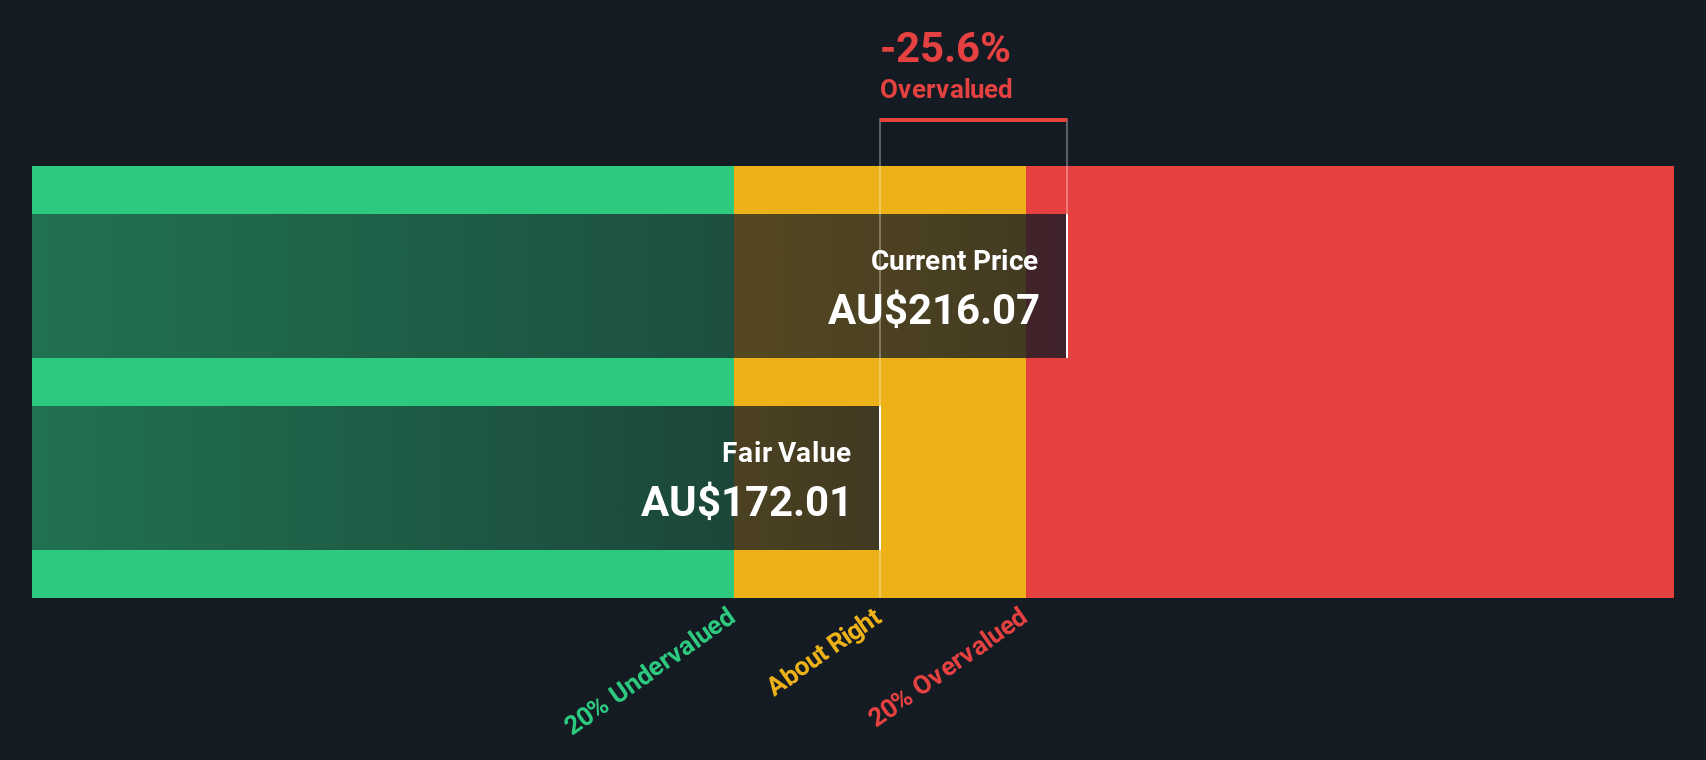
Key Insights
- REA Group's estimated fair value is AU$172 based on 2 Stage Free Cash Flow to Equity
- REA Group's AU$216 share price signals that it might be 26% overvalued
- Analyst price target for REA is AU$256, which is 49% above our fair value estimate
Today we will run through one way of estimating the intrinsic value of REA Group Limited (ASX:REA) by taking the expected future cash flows and discounting them to their present value. One way to achieve this is by employing the Discounted Cash Flow (DCF) model. It may sound complicated, but actually it is quite simple!
We generally believe that a company's value is the present value of all of the cash it will generate in the future. However, a DCF is just one valuation metric among many, and it is not without flaws. If you still have some burning questions about this type of valuation, take a look at the Simply Wall St analysis model.
Crunching The Numbers
We use what is known as a 2-stage model, which simply means we have two different periods of growth rates for the company's cash flows. Generally the first stage is higher growth, and the second stage is a lower growth phase. In the first stage we need to estimate the cash flows to the business over the next ten years. Where possible we use analyst estimates, but when these aren't available we extrapolate the previous free cash flow (FCF) from the last estimate or reported value. We assume companies with shrinking free cash flow will slow their rate of shrinkage, and that companies with growing free cash flow will see their growth rate slow, over this period. We do this to reflect that growth tends to slow more in the early years than it does in later years.
A DCF is all about the idea that a dollar in the future is less valuable than a dollar today, and so the sum of these future cash flows is then discounted to today's value:
10-year free cash flow (FCF) forecast
| 2026 | 2027 | 2028 | 2029 | 2030 | 2031 | 2032 | 2033 | 2034 | 2035 | |
| Levered FCF (A$, Millions) | AU$678.2m | AU$788.9m | AU$905.1m | AU$993.3m | AU$1.07b | AU$1.14b | AU$1.20b | AU$1.26b | AU$1.31b | AU$1.36b |
| Growth Rate Estimate Source | Analyst x6 | Analyst x6 | Analyst x6 | Est @ 9.75% | Est @ 7.76% | Est @ 6.36% | Est @ 5.39% | Est @ 4.70% | Est @ 4.23% | Est @ 3.89% |
| Present Value (A$, Millions) Discounted @ 7.5% | AU$631 | AU$683 | AU$729 | AU$745 | AU$747 | AU$739 | AU$725 | AU$706 | AU$685 | AU$662 |
("Est" = FCF growth rate estimated by Simply Wall St)
Present Value of 10-year Cash Flow (PVCF) = AU$7.1b
The second stage is also known as Terminal Value, this is the business's cash flow after the first stage. For a number of reasons a very conservative growth rate is used that cannot exceed that of a country's GDP growth. In this case we have used the 5-year average of the 10-year government bond yield (3.1%) to estimate future growth. In the same way as with the 10-year 'growth' period, we discount future cash flows to today's value, using a cost of equity of 7.5%.
Terminal Value (TV)= FCF2035 × (1 + g) ÷ (r – g) = AU$1.4b× (1 + 3.1%) ÷ (7.5%– 3.1%) = AU$32b
Present Value of Terminal Value (PVTV)= TV / (1 + r)10= AU$32b÷ ( 1 + 7.5%)10= AU$16b
The total value, or equity value, is then the sum of the present value of the future cash flows, which in this case is AU$23b. To get the intrinsic value per share, we divide this by the total number of shares outstanding. Compared to the current share price of AU$216, the company appears slightly overvalued at the time of writing. The assumptions in any calculation have a big impact on the valuation, so it is better to view this as a rough estimate, not precise down to the last cent.
Important Assumptions
Now the most important inputs to a discounted cash flow are the discount rate, and of course, the actual cash flows. If you don't agree with these result, have a go at the calculation yourself and play with the assumptions. The DCF also does not consider the possible cyclicality of an industry, or a company's future capital requirements, so it does not give a full picture of a company's potential performance. Given that we are looking at REA Group as potential shareholders, the cost of equity is used as the discount rate, rather than the cost of capital (or weighted average cost of capital, WACC) which accounts for debt. In this calculation we've used 7.5%, which is based on a levered beta of 1.036. Beta is a measure of a stock's volatility, compared to the market as a whole. We get our beta from the industry average beta of globally comparable companies, with an imposed limit between 0.8 and 2.0, which is a reasonable range for a stable business.
See our latest analysis for REA Group
SWOT Analysis for REA Group
Strength
- Earnings growth over the past year exceeded the industry.
- Currently debt free.
Weakness
- Dividend is low compared to the top 25% of dividend payers in the Interactive Media and Services market.
Opportunity
- Annual revenue is forecast to grow faster than the Australian market.
- Good value based on P/E ratio compared to estimated Fair P/E ratio.
Threat
- Annual earnings are forecast to grow slower than the Australian market.
Next Steps:
Although the valuation of a company is important, it is only one of many factors that you need to assess for a company. DCF models are not the be-all and end-all of investment valuation. Rather it should be seen as a guide to "what assumptions need to be true for this stock to be under/overvalued?" For instance, if the terminal value growth rate is adjusted slightly, it can dramatically alter the overall result. What is the reason for the share price exceeding the intrinsic value? For REA Group, there are three essential items you should explore:
- Risks: For example, we've discovered 1 warning sign for REA Group that you should be aware of before investing here.
- Future Earnings: How does REA's growth rate compare to its peers and the wider market? Dig deeper into the analyst consensus number for the upcoming years by interacting with our free analyst growth expectation chart.
- Other High Quality Alternatives: Do you like a good all-rounder? Explore our interactive list of high quality stocks to get an idea of what else is out there you may be missing!
PS. Simply Wall St updates its DCF calculation for every Australian stock every day, so if you want to find the intrinsic value of any other stock just search here.
New: AI Stock Screener & Alerts
Our new AI Stock Screener scans the market every day to uncover opportunities.
• Dividend Powerhouses (3%+ Yield)
• Undervalued Small Caps with Insider Buying
• High growth Tech and AI Companies
Or build your own from over 50 metrics.
Have feedback on this article? Concerned about the content? Get in touch with us directly. Alternatively, email editorial-team (at) simplywallst.com.
This article by Simply Wall St is general in nature. We provide commentary based on historical data and analyst forecasts only using an unbiased methodology and our articles are not intended to be financial advice. It does not constitute a recommendation to buy or sell any stock, and does not take account of your objectives, or your financial situation. We aim to bring you long-term focused analysis driven by fundamental data. Note that our analysis may not factor in the latest price-sensitive company announcements or qualitative material. Simply Wall St has no position in any stocks mentioned.
About ASX:REA
REA Group
Engages in online property advertising business in Australia, Asia, and North America It provides property and property-related services on websites and mobile applications.
Outstanding track record with flawless balance sheet.
Similar Companies
Market Insights

Advertisement
Community Narratives
Kodiak AI - a potential 100 bagger opportunity?
Fair Value US$14.00|44.7% undervalued
DA
Community Contributor
A Fair Price for a Great Business Facing Real Threats
Fair Value US$383.06|13.0% undervalued
IM
Community Contributor
AXON And Shopify Integration Will Unlock Global Mobile Advertising
Fair Value US$646.30|0% overvalued
AN
Based on Analyst Price Targets