
Advertisement
- Australia
- /
- Entertainment
- /
- ASX:EVT
Further weakness as EVT (ASX:EVT) drops 5.0% this week, taking three-year losses to 6.5%
As an investor its worth striving to ensure your overall portfolio beats the market average. But in any portfolio, there are likely to be some stocks that fall short of that benchmark. Unfortunately, that's been the case for longer term EVT Limited (ASX:EVT) shareholders, since the share price is down 11% in the last three years, falling well short of the market return of around 17%.
Given the past week has been tough on shareholders, let's investigate the fundamentals and see what we can learn.
View our latest analysis for EVT
There is no denying that markets are sometimes efficient, but prices do not always reflect underlying business performance. By comparing earnings per share (EPS) and share price changes over time, we can get a feel for how investor attitudes to a company have morphed over time.
During five years of share price growth, EVT moved from a loss to profitability. That would generally be considered a positive, so we are surprised to see the share price is down. So given the share price is down it's worth checking some other metrics too.
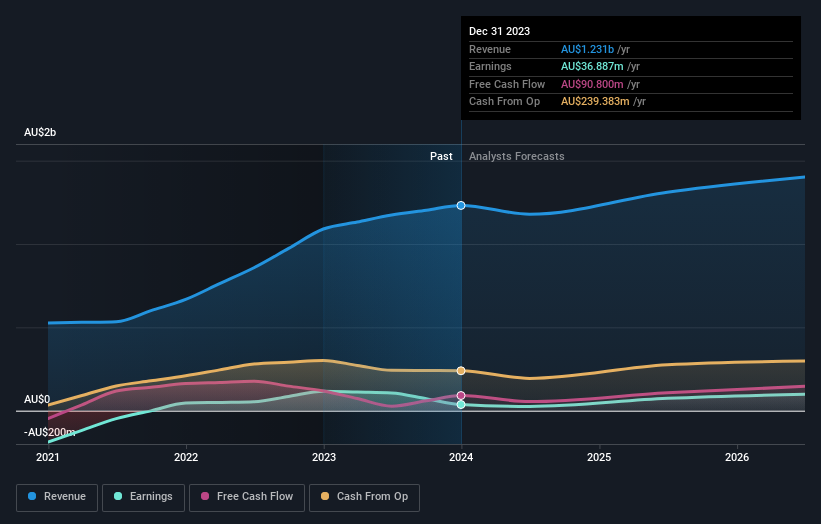
We note that, in three years, revenue has actually grown at a 32% annual rate, so that doesn't seem to be a reason to sell shares. This analysis is just perfunctory, but it might be worth researching EVT more closely, as sometimes stocks fall unfairly. This could present an opportunity.
You can see below how earnings and revenue have changed over time (discover the exact values by clicking on the image).
We know that EVT has improved its bottom line over the last three years, but what does the future have in store? You can see how its balance sheet has strengthened (or weakened) over time in this free interactive graphic.
What About Dividends?
When looking at investment returns, it is important to consider the difference between total shareholder return (TSR) and share price return. Whereas the share price return only reflects the change in the share price, the TSR includes the value of dividends (assuming they were reinvested) and the benefit of any discounted capital raising or spin-off. So for companies that pay a generous dividend, the TSR is often a lot higher than the share price return. As it happens, EVT's TSR for the last 3 years was -6.5%, which exceeds the share price return mentioned earlier. The dividends paid by the company have thusly boosted the total shareholder return.
A Different Perspective
EVT shareholders are down 5.8% for the year (even including dividends), but the market itself is up 13%. However, keep in mind that even the best stocks will sometimes underperform the market over a twelve month period. Regrettably, last year's performance caps off a bad run, with the shareholders facing a total loss of 0.2% per year over five years. Generally speaking long term share price weakness can be a bad sign, though contrarian investors might want to research the stock in hope of a turnaround. It's always interesting to track share price performance over the longer term. But to understand EVT better, we need to consider many other factors. Consider risks, for instance. Every company has them, and we've spotted 2 warning signs for EVT you should know about.
For those who like to find winning investments this free list of undervalued companies with recent insider purchasing, could be just the ticket.
Please note, the market returns quoted in this article reflect the market weighted average returns of stocks that currently trade on Australian exchanges.
Valuation is complex, but we're here to simplify it.
Discover if EVT might be undervalued or overvalued with our detailed analysis, featuring fair value estimates, potential risks, dividends, insider trades, and its financial condition.
Access Free AnalysisHave feedback on this article? Concerned about the content? Get in touch with us directly. Alternatively, email editorial-team (at) simplywallst.com.
This article by Simply Wall St is general in nature. We provide commentary based on historical data and analyst forecasts only using an unbiased methodology and our articles are not intended to be financial advice. It does not constitute a recommendation to buy or sell any stock, and does not take account of your objectives, or your financial situation. We aim to bring you long-term focused analysis driven by fundamental data. Note that our analysis may not factor in the latest price-sensitive company announcements or qualitative material. Simply Wall St has no position in any stocks mentioned.
About ASX:EVT
EVT
Engages in the entertainment business in Australia, New Zealand, Singapore, and Germany.
Proven track record with mediocre balance sheet.
Similar Companies
Market Insights

Advertisement
Community Narratives
Quality at a Premium. A time to watch, not to buy?
Fair Value US$154.56|29.0% undervalued
DA
Community Contributor
GRAB: The Super-App at the Heart of Southeast Asia’s Digital Boom
Fair Value US$8.20|22.6% undervalued
BL
Community Contributor
Verve Group to Surge with 51.61% Revenue Growth
Fair Value €6.00|63.2% undervalued
ME
Community Contributor