- Australia
- /
- Metals and Mining
- /
- ASX:SBM
Further weakness as St Barbara (ASX:SBM) drops 10% this week, taking five-year losses to 85%


Long term investing is the way to go, but that doesn't mean you should hold every stock forever. It hits us in the gut when we see fellow investors suffer a loss. Anyone who held St Barbara Limited (ASX:SBM) for five years would be nursing their metaphorical wounds since the share price dropped 94% in that time. Shareholders have had an even rougher run lately, with the share price down 22% in the last 90 days. We really feel for shareholders in this scenario. It's a good reminder of the importance of diversification, and it's worth keeping in mind there's more to life than money, anyway.
Since St Barbara has shed AU$20m from its value in the past 7 days, let's see if the longer term decline has been driven by the business' economics.
See our latest analysis for St Barbara
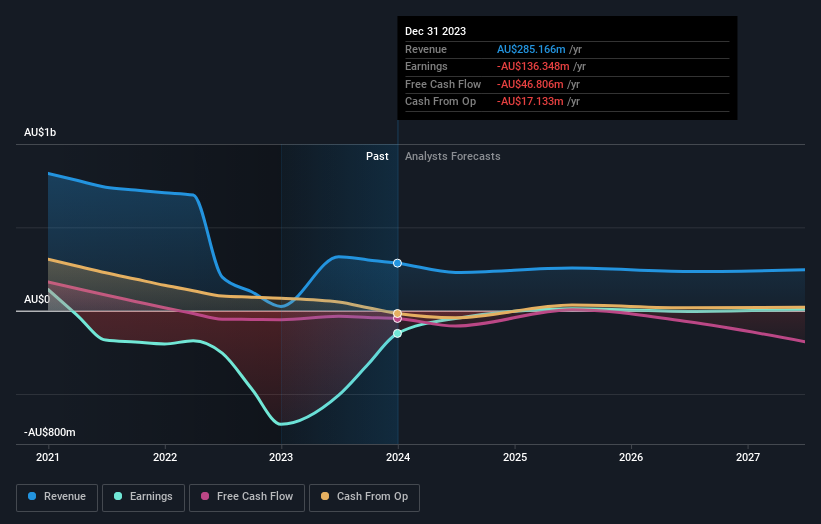
Given that St Barbara didn't make a profit in the last twelve months, we'll focus on revenue growth to form a quick view of its business development. Generally speaking, companies without profits are expected to grow revenue every year, and at a good clip. As you can imagine, fast revenue growth, when maintained, often leads to fast profit growth.
Over half a decade St Barbara reduced its trailing twelve month revenue by 20% for each year. That puts it in an unattractive cohort, to put it mildly. So it's not altogether surprising to see the share price down 14% per year in the same time period. This kind of price performance makes us very wary, especially when combined with falling revenue. Of course, the poor performance could mean the market has been too severe selling down. That can happen.
The company's revenue and earnings (over time) are depicted in the image below (click to see the exact numbers).
Balance sheet strength is crucial. It might be well worthwhile taking a look at our free report on how its financial position has changed over time.
What About The Total Shareholder Return (TSR)?
Investors should note that there's a difference between St Barbara's total shareholder return (TSR) and its share price change, which we've covered above. The TSR is a return calculation that accounts for the value of cash dividends (assuming that any dividend received was reinvested) and the calculated value of any discounted capital raisings and spin-offs. Its history of dividend payouts mean that St Barbara's TSR, which was a 85% drop over the last 5 years, was not as bad as the share price return.
A Different Perspective
While the broader market gained around 12% in the last year, St Barbara shareholders lost 14%. However, keep in mind that even the best stocks will sometimes underperform the market over a twelve month period. However, the loss over the last year isn't as bad as the 13% per annum loss investors have suffered over the last half decade. We would want clear information suggesting the company will grow, before taking the view that the share price will stabilize. Before spending more time on St Barbara it might be wise to click here to see if insiders have been buying or selling shares.
If you are like me, then you will not want to miss this free list of undervalued small caps that insiders are buying.
Please note, the market returns quoted in this article reflect the market weighted average returns of stocks that currently trade on Australian exchanges.
New: Manage All Your Stock Portfolios in One Place
We've created the ultimate portfolio companion for stock investors, and it's free.
• Connect an unlimited number of Portfolios and see your total in one currency
• Be alerted to new Warning Signs or Risks via email or mobile
• Track the Fair Value of your stocks
Have feedback on this article? Concerned about the content? Get in touch with us directly. Alternatively, email editorial-team (at) simplywallst.com.
This article by Simply Wall St is general in nature. We provide commentary based on historical data and analyst forecasts only using an unbiased methodology and our articles are not intended to be financial advice. It does not constitute a recommendation to buy or sell any stock, and does not take account of your objectives, or your financial situation. We aim to bring you long-term focused analysis driven by fundamental data. Note that our analysis may not factor in the latest price-sensitive company announcements or qualitative material. Simply Wall St has no position in any stocks mentioned.
Have feedback on this article? Concerned about the content? Get in touch with us directly. Alternatively, email editorial-team@simplywallst.com
About ASX:SBM
St Barbara
Engages in the exploration, development, mining, and sale of gold.
Excellent balance sheet with reasonable growth potential.
Similar Companies
Market Insights

Community Narratives


