Advertisement
- Australia
- /
- Metals and Mining
- /
- ASX:TAM
ASX Penny Stocks: 3 Picks With Market Caps Under A$400M

Simply Wall St
Reviewed by Simply Wall St
As the ASX 200 looks to open with a modest rise, driven by international trade talks and local economic developments, investors are keeping a close eye on market movements. Penny stocks, though a somewhat outdated term, continue to pique interest due to their potential for growth at lower price points. By focusing on companies with strong financials and solid fundamentals, investors can uncover opportunities in this often-overlooked segment of the market.
Top 10 Penny Stocks In Australia
| Name | Share Price | Market Cap | Rewards & Risks |
| Lindsay Australia (ASX:LAU) | A$0.665 | A$210.92M | ✅ 4 ⚠️ 2 View Analysis > |
| CTI Logistics (ASX:CLX) | A$1.835 | A$147.8M | ✅ 4 ⚠️ 2 View Analysis > |
| Accent Group (ASX:AX1) | A$1.875 | A$1.13B | ✅ 4 ⚠️ 2 View Analysis > |
| EZZ Life Science Holdings (ASX:EZZ) | A$1.54 | A$72.65M | ✅ 4 ⚠️ 2 View Analysis > |
| IVE Group (ASX:IGL) | A$2.62 | A$403.96M | ✅ 4 ⚠️ 2 View Analysis > |
| GTN (ASX:GTN) | A$0.60 | A$114.64M | ✅ 3 ⚠️ 2 View Analysis > |
| Bisalloy Steel Group (ASX:BIS) | A$3.63 | A$172.24M | ✅ 3 ⚠️ 1 View Analysis > |
| Regal Partners (ASX:RPL) | A$2.12 | A$712.67M | ✅ 4 ⚠️ 4 View Analysis > |
| Navigator Global Investments (ASX:NGI) | A$1.705 | A$835.59M | ✅ 5 ⚠️ 3 View Analysis > |
| Tasmea (ASX:TEA) | A$2.95 | A$690.41M | ✅ 4 ⚠️ 2 View Analysis > |
Click here to see the full list of 998 stocks from our ASX Penny Stocks screener.
Let's explore several standout options from the results in the screener.
Caravel Minerals (ASX:CVV)
Simply Wall St Financial Health Rating: ★★★★★★
Overview: Caravel Minerals Limited, with a market cap of A$100.58 million, explores for mineral tenements in Western Australia through its subsidiaries.
Operations: Caravel Minerals Limited does not report any revenue segments.
Market Cap: A$100.58M
Caravel Minerals Limited, with a market cap of A$100.58 million, is pre-revenue and currently unprofitable, reporting a net loss of A$4.51 million for the half year ended December 31, 2024. Despite this, the company maintains strong financial health with no debt and short-term assets exceeding liabilities by A$7.8 million. The management team is experienced with an average tenure of over five years, providing stability in leadership. Shareholder dilution has not been significant recently, and Caravel possesses a cash runway sufficient for over a year under current conditions despite declining earnings historically.
- Click to explore a detailed breakdown of our findings in Caravel Minerals' financial health report.
- Assess Caravel Minerals' previous results with our detailed historical performance reports.
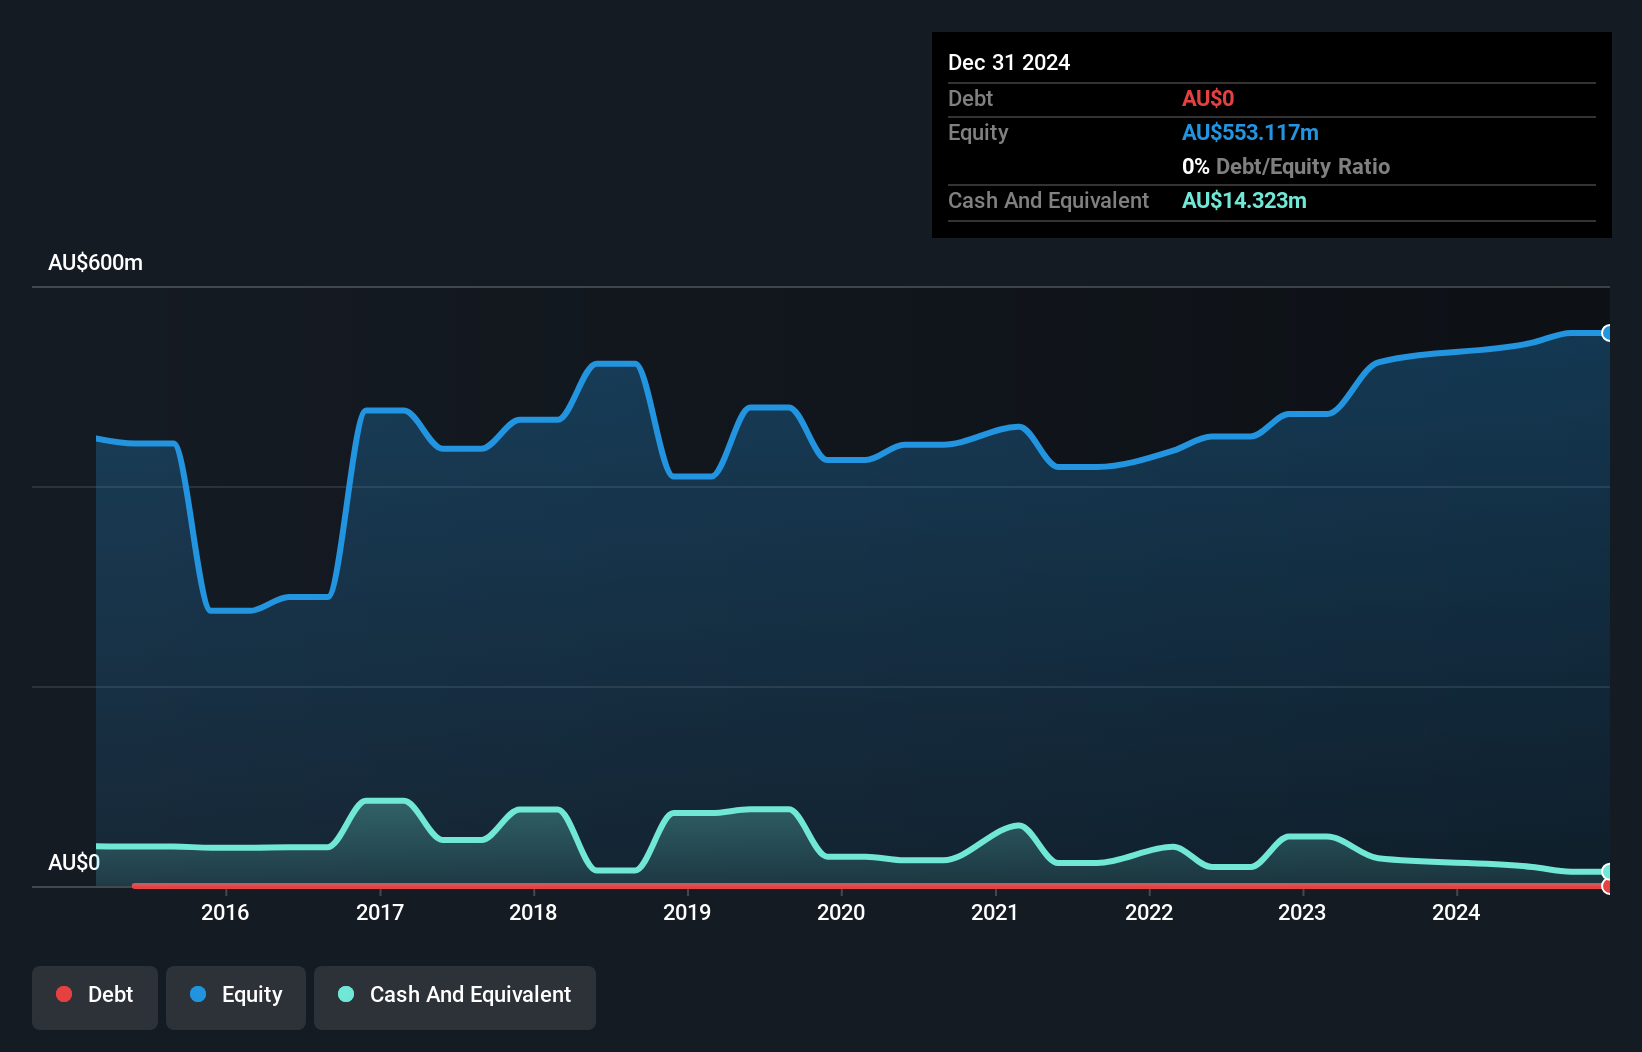
Jupiter Mines (ASX:JMS)
Simply Wall St Financial Health Rating: ★★★★★★
Overview: Jupiter Mines Limited is an independent mining company based in Australia with a market capitalization of A$382.40 million.
Operations: The company generates revenue from its manganese operations in South Africa, amounting to A$9.49 million.
Market Cap: A$382.4M
Jupiter Mines Limited, with a market cap of A$382.40 million, operates in the manganese sector and reported half-year sales of A$4.32 million. Despite being debt-free for five years and having short-term assets exceeding liabilities, the company's earnings have declined by 11.6% annually over five years and experienced negative growth last year. The dividend yield of 6.41% is not well covered by free cash flows, raising sustainability concerns. Recent board changes include appointing Kiho Han as Director in April 2025, highlighting a relatively inexperienced management team with an average tenure under two years.
- Click here and access our complete financial health analysis report to understand the dynamics of Jupiter Mines.
- Gain insights into Jupiter Mines' future direction by reviewing our growth report.
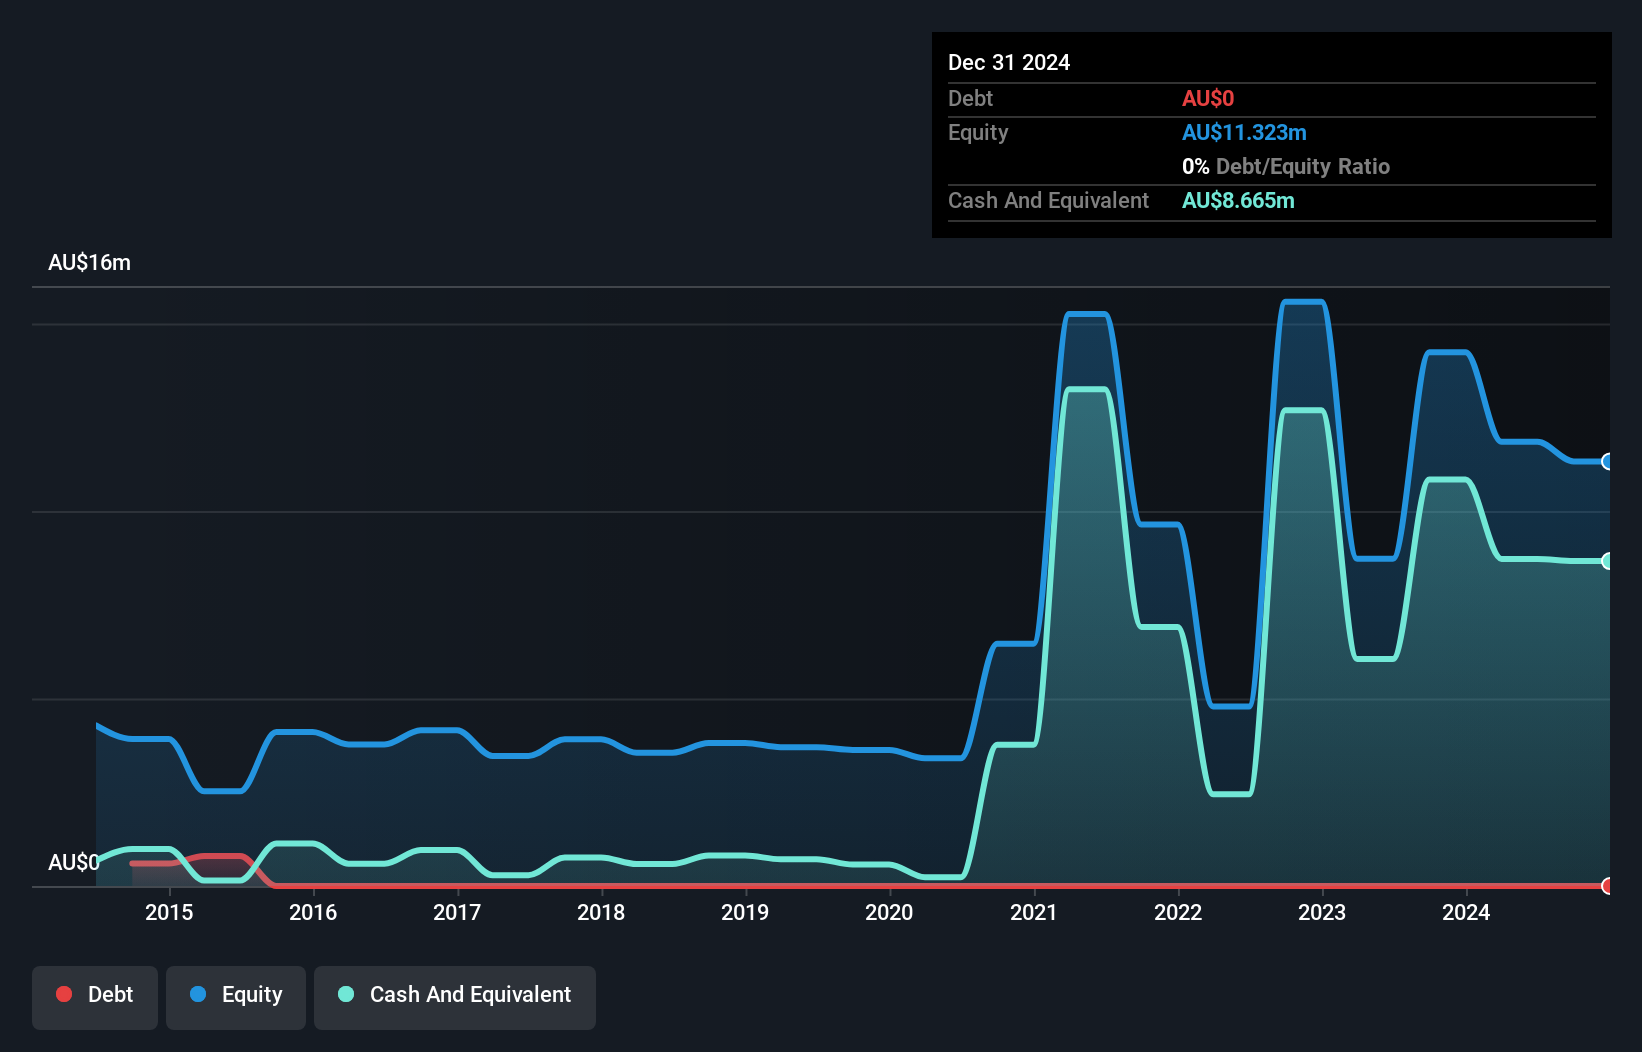
Tanami Gold (ASX:TAM)
Simply Wall St Financial Health Rating: ★★★★★★
Overview: Tanami Gold NL, with a market cap of A$52.88 million, is involved in the exploration and evaluation of gold properties in Australia through its subsidiaries.
Operations: Tanami Gold NL does not report any specific revenue segments.
Market Cap: A$52.88M
Tanami Gold NL, with a market cap of A$52.88 million, is pre-revenue and debt-free, making it an intriguing prospect in the penny stock realm. The company's short-term assets of A$32.9 million comfortably cover both its short-term and long-term liabilities. However, it remains unprofitable with increasing losses over the past five years at a rate of 44% annually. Recent earnings results for the half-year ended December 2024 showed a net loss of A$3.17 million, slightly improved from the previous year’s loss of A$3.66 million. The board's average tenure is 12.8 years, indicating experienced governance despite management data being insufficient to assess experience levels fully.
- Navigate through the intricacies of Tanami Gold with our comprehensive balance sheet health report here.
- Evaluate Tanami Gold's historical performance by accessing our past performance report.

Seize The Opportunity
- Unlock more gems! Our ASX Penny Stocks screener has unearthed 995 more companies for you to explore.Click here to unveil our expertly curated list of 998 ASX Penny Stocks.
- Seeking Other Investments? The best AI stocks today may lie beyond giants like Nvidia and Microsoft. Find the next big opportunity with these 28 smaller AI-focused companies with strong growth potential through early-stage innovation in machine learning, automation, and data intelligence that could fund your retirement.
This article by Simply Wall St is general in nature. We provide commentary based on historical data and analyst forecasts only using an unbiased methodology and our articles are not intended to be financial advice. It does not constitute a recommendation to buy or sell any stock, and does not take account of your objectives, or your financial situation. We aim to bring you long-term focused analysis driven by fundamental data. Note that our analysis may not factor in the latest price-sensitive company announcements or qualitative material. Simply Wall St has no position in any stocks mentioned.
Valuation is complex, but we're here to simplify it.
Discover if Tanami Gold might be undervalued or overvalued with our detailed analysis, featuring fair value estimates, potential risks, dividends, insider trades, and its financial condition.
Access Free AnalysisHave feedback on this article? Concerned about the content? Get in touch with us directly. Alternatively, email editorial-team@simplywallst.com
About ASX:TAM
Flawless balance sheet with low risk.
Similar Companies
Market Insights

Advertisement
Community Narratives
MINISO's fair value is projected at 26.69 with an anticipated PE ratio shift of 20x
Fair Value US$24.03|11.0% undervalued
BE
Community Contributor
Procter & Gamble: A Dividend Giant Facing Slowing Growth
Fair Value US$119.81|23.3% overvalued
AN
Community Contributor
Eli Lilly's Future Growth Driven by Tirzepatide and Favorable Market Conditions
Fair Value US$1.19k|13.8% undervalued
EA
Community Contributor