
Advertisement
Just because a business does not make any money, does not mean that the stock will go down. For example, biotech and mining exploration companies often lose money for years before finding success with a new treatment or mineral discovery. But while history lauds those rare successes, those that fail are often forgotten; who remembers Pets.com?
So should ioneer (ASX:INR) shareholders be worried about its cash burn? For the purposes of this article, cash burn is the annual rate at which an unprofitable company spends cash to fund its growth; its negative free cash flow. Let's start with an examination of the business' cash, relative to its cash burn.
View our latest analysis for ioneer
How Long Is ioneer's Cash Runway?
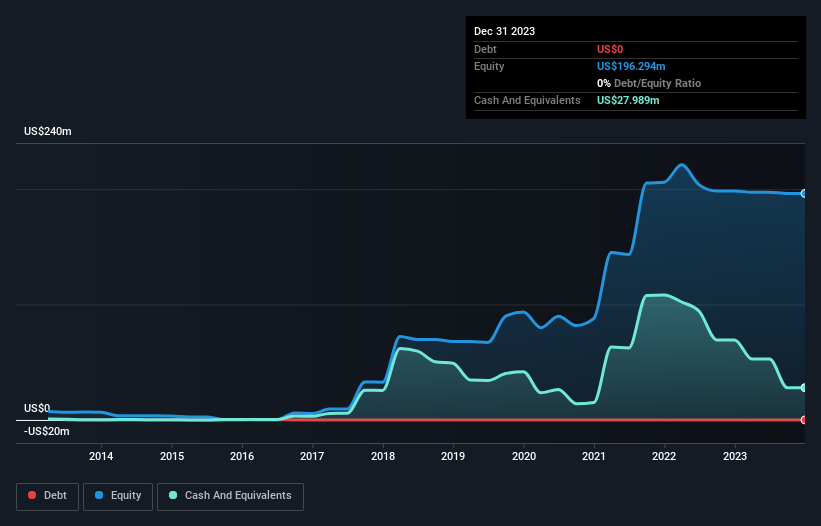
A company's cash runway is the amount of time it would take to burn through its cash reserves at its current cash burn rate. When ioneer last reported its December 2023 balance sheet in February 2024, it had zero debt and cash worth US$28m. In the last year, its cash burn was US$43m. Therefore, from December 2023 it had roughly 8 months of cash runway. That's quite a short cash runway, indicating the company must either reduce its annual cash burn or replenish its cash. You can see how its cash balance has changed over time in the image below.
How Is ioneer's Cash Burn Changing Over Time?
ioneer didn't record any revenue over the last year, indicating that it's an early stage company still developing its business. So while we can't look to sales to understand growth, we can look at how the cash burn is changing to understand how expenditure is trending over time. With the cash burn rate up 4.3% in the last year, it seems that the company is ratcheting up investment in the business over time. However, the company's true cash runway will therefore be shorter than suggested above, if spending continues to increase. While the past is always worth studying, it is the future that matters most of all. For that reason, it makes a lot of sense to take a look at our analyst forecasts for the company.
How Hard Would It Be For ioneer To Raise More Cash For Growth?
Since its cash burn is increasing (albeit only slightly), ioneer shareholders should still be mindful of the possibility it will require more cash in the future. Generally speaking, a listed business can raise new cash through issuing shares or taking on debt. Many companies end up issuing new shares to fund future growth. By comparing a company's annual cash burn to its total market capitalisation, we can estimate roughly how many shares it would have to issue in order to run the company for another year (at the same burn rate).
Since it has a market capitalisation of US$214m, ioneer's US$43m in cash burn equates to about 20% of its market value. That's fairly notable cash burn, so if the company had to sell shares to cover the cost of another year's operations, shareholders would suffer some costly dilution.
Is ioneer's Cash Burn A Worry?
ioneer is not in a great position when it comes to its cash burn situation. Although we can understand if some shareholders find its cash burn relative to its market cap acceptable, we can't ignore the fact that we consider its cash runway to be downright troublesome. Considering all the measures mentioned in this report, we reckon that its cash burn is fairly risky, and if we held shares we'd be watching like a hawk for any deterioration. Taking a deeper dive, we've spotted 5 warning signs for ioneer you should be aware of, and 3 of them shouldn't be ignored.
Of course ioneer may not be the best stock to buy. So you may wish to see this free collection of companies boasting high return on equity, or this list of stocks that insiders are buying.
Valuation is complex, but we're here to simplify it.
Discover if ioneer might be undervalued or overvalued with our detailed analysis, featuring fair value estimates, potential risks, dividends, insider trades, and its financial condition.
Access Free AnalysisHave feedback on this article? Concerned about the content? Get in touch with us directly. Alternatively, email editorial-team (at) simplywallst.com.
This article by Simply Wall St is general in nature. We provide commentary based on historical data and analyst forecasts only using an unbiased methodology and our articles are not intended to be financial advice. It does not constitute a recommendation to buy or sell any stock, and does not take account of your objectives, or your financial situation. We aim to bring you long-term focused analysis driven by fundamental data. Note that our analysis may not factor in the latest price-sensitive company announcements or qualitative material. Simply Wall St has no position in any stocks mentioned.
About ASX:INR
ioneer
Engages in the exploration and development of mineral properties, such as lithium and boron in North America.
Flawless balance sheet with slight risk.
Similar Companies
Market Insights

Advertisement
Community Narratives
Kodiak AI - a potential 100 bagger opportunity?
Fair Value US$14.00|41.9% undervalued
DA
Community Contributor
A Fair Price for a Great Business Facing Real Threats
Fair Value US$383.06|14.1% undervalued
IM
Community Contributor
AXON And Shopify Integration Will Unlock Global Mobile Advertising
Fair Value US$613.59|1.3% undervalued
AN
Based on Analyst Price Targets