

We can readily understand why investors are attracted to unprofitable companies. For example, although software-as-a-service business Salesforce.com lost money for years while it grew recurring revenue, if you held shares since 2005, you'd have done very well indeed. But the harsh reality is that very many loss making companies burn through all their cash and go bankrupt.
So should Industrial Minerals (ASX:IND) shareholders be worried about its cash burn? In this report, we will consider the company's annual negative free cash flow, henceforth referring to it as the 'cash burn'. First, we'll determine its cash runway by comparing its cash burn with its cash reserves.
Check out our latest analysis for Industrial Minerals
How Long Is Industrial Minerals' Cash Runway?
A company's cash runway is calculated by dividing its cash hoard by its cash burn. When Industrial Minerals last reported its balance sheet in June 2023, it had zero debt and cash worth AU$1.2m. Importantly, its cash burn was AU$2.2m over the trailing twelve months. So it had a cash runway of approximately 7 months from June 2023. To be frank, this kind of short runway puts us on edge, as it indicates the company must reduce its cash burn significantly, or else raise cash imminently. You can see how its cash balance has changed over time in the image below.
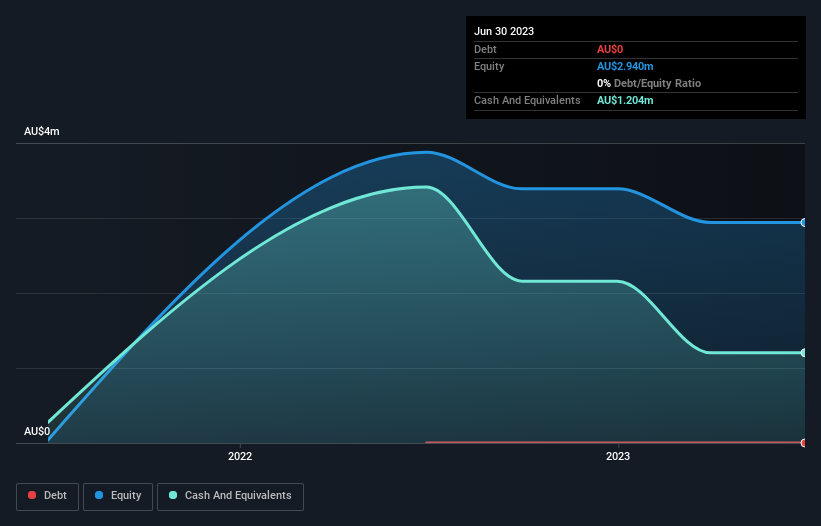
How Is Industrial Minerals' Cash Burn Changing Over Time?
Industrial Minerals didn't record any revenue over the last year, indicating that it's an early stage company still developing its business. So while we can't look to sales to understand growth, we can look at how the cash burn is changing to understand how expenditure is trending over time. With the cash burn rate up 48% in the last year, it seems that the company is ratcheting up investment in the business over time. However, the company's true cash runway will therefore be shorter than suggested above, if spending continues to increase. Industrial Minerals makes us a little nervous due to its lack of substantial operating revenue. We prefer most of the stocks on this list of stocks that analysts expect to grow.
Can Industrial Minerals Raise More Cash Easily?
Since its cash burn is moving in the wrong direction, Industrial Minerals shareholders may wish to think ahead to when the company may need to raise more cash. Generally speaking, a listed business can raise new cash through issuing shares or taking on debt. Commonly, a business will sell new shares in itself to raise cash and drive growth. We can compare a company's cash burn to its market capitalisation to get a sense for how many new shares a company would have to issue to fund one year's operations.
Since it has a market capitalisation of AU$39m, Industrial Minerals' AU$2.2m in cash burn equates to about 5.6% of its market value. That's a low proportion, so we figure the company would be able to raise more cash to fund growth, with a little dilution, or even to simply borrow some money.
How Risky Is Industrial Minerals' Cash Burn Situation?
On this analysis of Industrial Minerals' cash burn, we think its cash burn relative to its market cap was reassuring, while its cash runway has us a bit worried. Summing up, we think the Industrial Minerals' cash burn is a risk, based on the factors we mentioned in this article. Its important for readers to be cognizant of the risks that can affect the company's operations, and we've picked out 6 warning signs for Industrial Minerals that investors should know when investing in the stock.
Of course, you might find a fantastic investment by looking elsewhere. So take a peek at this free list of companies insiders are buying, and this list of stocks growth stocks (according to analyst forecasts)
If you're looking to trade Industrial Minerals, open an account with the lowest-cost platform trusted by professionals, Interactive Brokers.
With clients in over 200 countries and territories, and access to 160 markets, IBKR lets you trade stocks, options, futures, forex, bonds and funds from a single integrated account.
Enjoy no hidden fees, no account minimums, and FX conversion rates as low as 0.03%, far better than what most brokers offer.
Sponsored ContentNew: AI Stock Screener & Alerts
Our new AI Stock Screener scans the market every day to uncover opportunities.
• Dividend Powerhouses (3%+ Yield)
• Undervalued Small Caps with Insider Buying
• High growth Tech and AI Companies
Or build your own from over 50 metrics.
Have feedback on this article? Concerned about the content? Get in touch with us directly. Alternatively, email editorial-team (at) simplywallst.com.
This article by Simply Wall St is general in nature. We provide commentary based on historical data and analyst forecasts only using an unbiased methodology and our articles are not intended to be financial advice. It does not constitute a recommendation to buy or sell any stock, and does not take account of your objectives, or your financial situation. We aim to bring you long-term focused analysis driven by fundamental data. Note that our analysis may not factor in the latest price-sensitive company announcements or qualitative material. Simply Wall St has no position in any stocks mentioned.
About ASX:IND
Industrial Minerals
Engages in the evaluation and exploration of mineral projects in Western Australia.
Medium-low with adequate balance sheet.
Market Insights

Community Narratives

