
Advertisement
- Australia
- /
- Metals and Mining
- /
- ASX:BDM
Benign Growth For Burgundy Diamond Mines Limited (ASX:BDM) Underpins Its Share Price
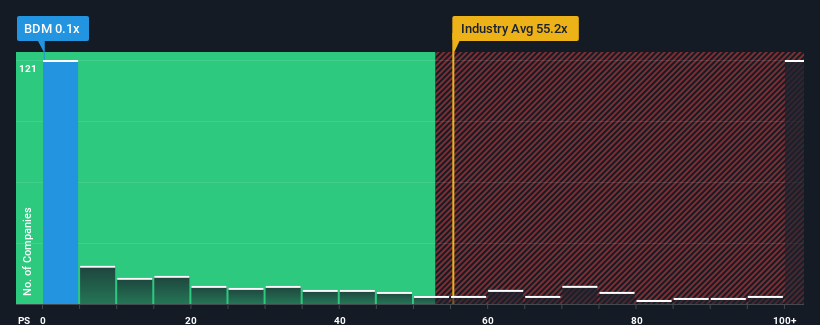
With a price-to-sales (or "P/S") ratio of 0.1x Burgundy Diamond Mines Limited (ASX:BDM) may be sending very bullish signals at the moment, given that almost half of all the Metals and Mining companies in Australia have P/S ratios greater than 55.2x and even P/S higher than 320x are not unusual. Although, it's not wise to just take the P/S at face value as there may be an explanation why it's so limited.
Check out our latest analysis for Burgundy Diamond Mines
What Does Burgundy Diamond Mines' P/S Mean For Shareholders?
Burgundy Diamond Mines could be doing better as its revenue has been going backwards lately while most other companies have been seeing positive revenue growth. The P/S ratio is probably low because investors think this poor revenue performance isn't going to get any better. If you still like the company, you'd be hoping this isn't the case so that you could potentially pick up some stock while it's out of favour.
Keen to find out how analysts think Burgundy Diamond Mines' future stacks up against the industry? In that case, our free report is a great place to start.Do Revenue Forecasts Match The Low P/S Ratio?
In order to justify its P/S ratio, Burgundy Diamond Mines would need to produce anemic growth that's substantially trailing the industry.
In reviewing the last year of financials, we were disheartened to see the company's revenues fell to the tune of 14%. This has erased any of its gains during the last three years, with practically no change in revenue being achieved in total. Accordingly, shareholders probably wouldn't have been overly satisfied with the unstable medium-term growth rates.
Shifting to the future, estimates from the lone analyst covering the company suggest revenue growth is heading into negative territory, declining 14% per year over the next three years. That's not great when the rest of the industry is expected to grow by 197% each year.
With this in consideration, we find it intriguing that Burgundy Diamond Mines' P/S is closely matching its industry peers. However, shrinking revenues are unlikely to lead to a stable P/S over the longer term. There's potential for the P/S to fall to even lower levels if the company doesn't improve its top-line growth.
What We Can Learn From Burgundy Diamond Mines' P/S?
While the price-to-sales ratio shouldn't be the defining factor in whether you buy a stock or not, it's quite a capable barometer of revenue expectations.
With revenue forecasts that are inferior to the rest of the industry, it's no surprise that Burgundy Diamond Mines' P/S is on the lower end of the spectrum. At this stage investors feel the potential for an improvement in revenue isn't great enough to justify a higher P/S ratio. Unless there's material change, it's hard to envision a situation where the stock price will rise drastically.
And what about other risks? Every company has them, and we've spotted 3 warning signs for Burgundy Diamond Mines (of which 2 can't be ignored!) you should know about.
It's important to make sure you look for a great company, not just the first idea you come across. So if growing profitability aligns with your idea of a great company, take a peek at this free list of interesting companies with strong recent earnings growth (and a low P/E).
Valuation is complex, but we're here to simplify it.
Discover if Burgundy Diamond Mines might be undervalued or overvalued with our detailed analysis, featuring fair value estimates, potential risks, dividends, insider trades, and its financial condition.
Access Free AnalysisHave feedback on this article? Concerned about the content? Get in touch with us directly. Alternatively, email editorial-team (at) simplywallst.com.
This article by Simply Wall St is general in nature. We provide commentary based on historical data and analyst forecasts only using an unbiased methodology and our articles are not intended to be financial advice. It does not constitute a recommendation to buy or sell any stock, and does not take account of your objectives, or your financial situation. We aim to bring you long-term focused analysis driven by fundamental data. Note that our analysis may not factor in the latest price-sensitive company announcements or qualitative material. Simply Wall St has no position in any stocks mentioned.
About ASX:BDM
Burgundy Diamond Mines
A resources company, focuses on the mining, production, cutting, polishing, grading, and sale of diamonds.
Good value with slight risk.
Market Insights

Advertisement
Community Narratives
The company that turned a verb into a global necessity and basically runs the modern internet, digital ads, smartphones, maps, and AI.
Fair Value US$300.00|6.3% undervalued
OS
Community Contributor
Flowers Foods Pays A Fair Price For Health
Fair Value US$16.12|26.0% undervalued
NV
Community Contributor
TMX Group will thrive with 33.3% profit margin and enduring market moat
Fair Value CA$49.90|3.7% overvalued
LI
Community Contributor