- Australia
- /
- Metals and Mining
- /
- ASX:A1M
A Look at AIC Mines (ASX:A1M) Valuation as Q1 2026 Results Date Approaches

Reviewed by Kshitija Bhandaru
Anticipation is building around AIC Mines (ASX:A1M) as the company confirmed it will release its Q1 2026 final results before the market opens on October 16, 2025. Investors know that earnings updates can reveal key financial and operational trends.
See our latest analysis for AIC Mines.
Recent momentum around AIC Mines stands out, with a 31.8% one-month share price return and a 35.9% gain over the last 90 days, suggesting growing optimism. Although long-term total returns are still catching up, short-term performance clearly signals renewed market interest ahead of results.
If news-driven rallies have you looking for what else is catching investors’ attention, broaden your search and discover fast growing stocks with high insider ownership
With shares rallying and analysts setting targets well above the current price, the question now is whether AIC Mines is trading at a discount or if the recent momentum means future growth is already reflected in the price.
Price-to-Earnings of 23.5x: Is it justified?
AIC Mines is currently trading at a price-to-earnings (P/E) ratio of 23.5x, with the last close at A$0.44. This multiple prices the company higher than both the industry average and the estimated fair P/E ratio, challenging the idea that current profits are fully reflected in the share price.
The price-to-earnings ratio measures how much investors are willing to pay for each dollar of earnings. For a resource and mining business like AIC Mines, it can signal expectations for profit stability and the perceived reliability of future earnings streams.
While the company is valued above the Metals and Mining industry average of 21.6x, it stands out as good value versus direct peers (average 35.7x). However, against the estimated fair P/E ratio of 22.2x, it still appears expensive. This may suggest that the market is anticipating continued earnings acceleration or that optimism is being priced in without full fundamental support.
Explore the SWS fair ratio for AIC Mines
Result: Price-to-Earnings of 23.5x (OVERVALUED)
However, weaker revenue growth or disappointing earnings momentum could quickly challenge the current optimism and shift investor sentiment around AIC Mines.
Find out about the key risks to this AIC Mines narrative.
Another View: Discounted Cash Flow Tells a Different Story
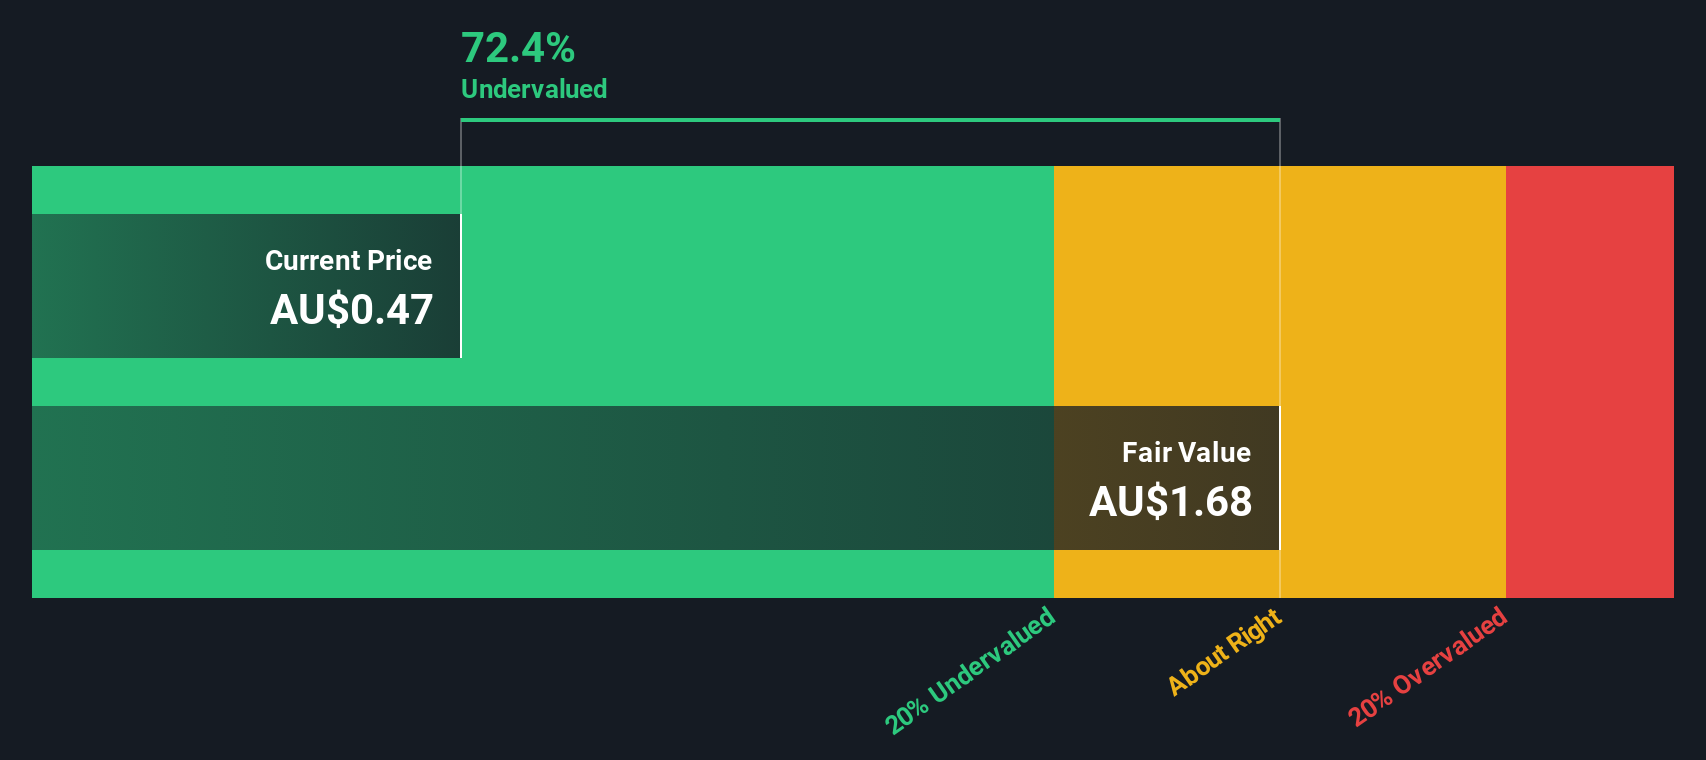
While the P/E ratio suggests AIC Mines shares are expensive compared to industry and the fair ratio, our DCF model points in the opposite direction. In this view, the shares are trading nearly 77% below estimated fair value, hinting at potential undervaluation that multiples might miss. Which perspective will prove right?
Look into how the SWS DCF model arrives at its fair value.
Simply Wall St performs a discounted cash flow (DCF) on every stock in the world every day (check out AIC Mines for example). We show the entire calculation in full. You can track the result in your watchlist or portfolio and be alerted when this changes, or use our stock screener to discover undervalued stocks based on their cash flows. If you save a screener we even alert you when new companies match - so you never miss a potential opportunity.
Build Your Own AIC Mines Narrative
If you see the story playing out differently or want to dive deeper on your own, you can build your own take in just a few minutes. Do it your way
A great starting point for your AIC Mines research is our analysis highlighting 3 key rewards and 2 important warning signs that could impact your investment decision.
Looking for more investment ideas?
Smart investing means spotting promising trends before the crowd. Don’t let tomorrow’s biggest opportunities pass you by. Use these handpicked tools to keep your portfolio ahead:
- Capture impressive returns from under-the-radar opportunities by checking out these 3569 penny stocks with strong financials with strong fundamentals and growth on their side.
- Secure passive income streams by evaluating these 18 dividend stocks with yields > 3% offering reliable yields above 3% for income-focused investors.
- Get ahead of the curve in healthcare innovation by analyzing these 33 healthcare AI stocks powering breakthroughs with artificial intelligence.
This article by Simply Wall St is general in nature. We provide commentary based on historical data and analyst forecasts only using an unbiased methodology and our articles are not intended to be financial advice. It does not constitute a recommendation to buy or sell any stock, and does not take account of your objectives, or your financial situation. We aim to bring you long-term focused analysis driven by fundamental data. Note that our analysis may not factor in the latest price-sensitive company announcements or qualitative material. Simply Wall St has no position in any stocks mentioned.
Mobile Infrastructure for Defense and Disaster
The next wave in robotics isn't humanoid. Its fully autonomous towers delivering 5G, ISR, and radar in under 30 minutes, anywhere.
Get the investor briefing before the next round of contracts
Sponsored On Behalf of CiTechNew: Manage All Your Stock Portfolios in One Place
We've created the ultimate portfolio companion for stock investors, and it's free.
• Connect an unlimited number of Portfolios and see your total in one currency
• Be alerted to new Warning Signs or Risks via email or mobile
• Track the Fair Value of your stocks
Have feedback on this article? Concerned about the content? Get in touch with us directly. Alternatively, email editorial-team@simplywallst.com
About ASX:A1M
AIC Mines
Engages in the exploration, development, and production of mines in Australia.
Excellent balance sheet with reasonable growth potential.
Similar Companies
Market Insights

Weekly Picks

THE KINGDOM OF BROWN GOODS: WHY MGPI IS BEING CRUSHED BY INVENTORY & PRIMED FOR RESURRECTION


Why Vertical Aerospace (NYSE: EVTL) is Worth Possibly Over 13x its Current Price


The Quiet Giant That Became AI’s Power Grid
Recently Updated Narratives


Fiverr International will transform the freelance industry with AI-powered growth

Jackson Financial Stock: When Insurance Math Meets a Shifting Claims Landscape

Stride Stock: Online Education Finds Its Second Act
Popular Narratives


MicroVision will explode future revenue by 380.37% with a vision towards success


Crazy Undervalued 42 Baggers Silver Play (Active & Running Mine)


NVDA: Expanding AI Demand Will Drive Major Data Center Investments Through 2026
Trending Discussion
