- Australia
- /
- Construction
- /
- ASX:WOR
Worley Limited's (ASX:WOR) On An Uptrend But Financial Prospects Look Pretty Weak: Is The Stock Overpriced?


Most readers would already be aware that Worley's (ASX:WOR) stock increased significantly by 15% over the past three months. However, in this article, we decided to focus on its weak fundamentals, as long-term financial performance of a business is what ultimately dictates market outcomes. Particularly, we will be paying attention to Worley's ROE today.
ROE or return on equity is a useful tool to assess how effectively a company can generate returns on the investment it received from its shareholders. Put another way, it reveals the company's success at turning shareholder investments into profits.
See our latest analysis for Worley
How To Calculate Return On Equity?
The formula for return on equity is:
Return on Equity = Net Profit (from continuing operations) ÷ Shareholders' Equity
So, based on the above formula, the ROE for Worley is:
3.1% = AU$177m ÷ AU$5.7b (Based on the trailing twelve months to June 2022).
The 'return' is the yearly profit. That means that for every A$1 worth of shareholders' equity, the company generated A$0.03 in profit.
Why Is ROE Important For Earnings Growth?
We have already established that ROE serves as an efficient profit-generating gauge for a company's future earnings. Based on how much of its profits the company chooses to reinvest or "retain", we are then able to evaluate a company's future ability to generate profits. Generally speaking, other things being equal, firms with a high return on equity and profit retention, have a higher growth rate than firms that don’t share these attributes.
Worley's Earnings Growth And 3.1% ROE
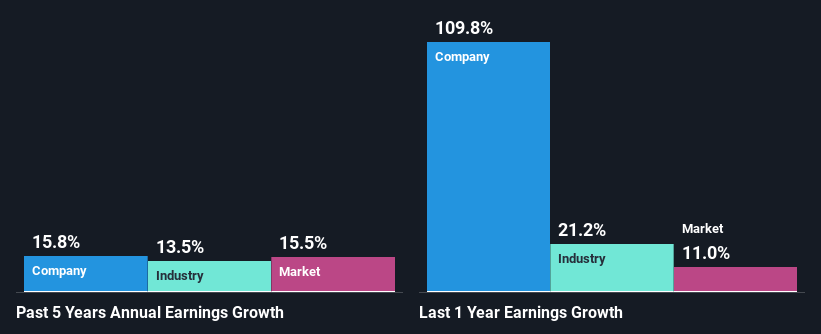
It is quite clear that Worley's ROE is rather low. Even when compared to the industry average of 8.6%, the ROE figure is pretty disappointing. Worley was still able to see a decent net income growth of 16% over the past five years. Therefore, the growth in earnings could probably have been caused by other variables. For instance, the company has a low payout ratio or is being managed efficiently.
As a next step, we compared Worley's net income growth with the industry and were disappointed to see that the company's growth is lower than the industry average growth of 36% in the same period.
Earnings growth is an important metric to consider when valuing a stock. The investor should try to establish if the expected growth or decline in earnings, whichever the case may be, is priced in. By doing so, they will have an idea if the stock is headed into clear blue waters or if swampy waters await. One good indicator of expected earnings growth is the P/E ratio which determines the price the market is willing to pay for a stock based on its earnings prospects. So, you may want to check if Worley is trading on a high P/E or a low P/E, relative to its industry.
Is Worley Making Efficient Use Of Its Profits?
Worley's high three-year median payout ratio of 168% suggests that the company is paying out more to its shareholders than what it is making. In spite of this, the company was able to grow its earnings respectably, as we saw above. That being said, the high payout ratio could be worth keeping an eye on in case the company is unable to keep up its current growth momentum.
Additionally, Worley has paid dividends over a period of at least ten years which means that the company is pretty serious about sharing its profits with shareholders. Our latest analyst data shows that the future payout ratio of the company is expected to drop to 68% over the next three years. As a result, the expected drop in Worley's payout ratio explains the anticipated rise in the company's future ROE to 7.9%, over the same period.
Summary
On the whole, Worley's performance is quite a big let-down. While no doubt its earnings growth is pretty respectable, its ROE and earnings retention is quite poor. So while the company has managed to grow its earnings in spite of this, we are unconvinced if this growth could extend, specially during troubled times. The latest industry analyst forecasts show that the company is expected to maintain its current growth rate. Are these analysts expectations based on the broad expectations for the industry, or on the company's fundamentals? Click here to be taken to our analyst's forecasts page for the company.
Valuation is complex, but we're here to simplify it.
Discover if Worley might be undervalued or overvalued with our detailed analysis, featuring fair value estimates, potential risks, dividends, insider trades, and its financial condition.
Access Free AnalysisHave feedback on this article? Concerned about the content? Get in touch with us directly. Alternatively, email editorial-team (at) simplywallst.com.
This article by Simply Wall St is general in nature. We provide commentary based on historical data and analyst forecasts only using an unbiased methodology and our articles are not intended to be financial advice. It does not constitute a recommendation to buy or sell any stock, and does not take account of your objectives, or your financial situation. We aim to bring you long-term focused analysis driven by fundamental data. Note that our analysis may not factor in the latest price-sensitive company announcements or qualitative material. Simply Wall St has no position in any stocks mentioned.
About ASX:WOR
Worley
Provides professional services to energy, chemicals, and resources sectors worldwide.
Flawless balance sheet with solid track record.
Similar Companies
Market Insights

Community Narratives


