- Australia
- /
- Oil and Gas
- /
- ASX:VEA
Viva Energy Group's (ASX:VEA) investors will be pleased with their impressive 136% return over the last three years

One simple way to benefit from the stock market is to buy an index fund. But if you choose individual stocks with prowess, you can make superior returns. For example, Viva Energy Group Limited (ASX:VEA) shareholders have seen the share price rise 64% over three years, well in excess of the market return (35%, not including dividends). However, more recent returns haven't been as impressive as that, with the stock returning just 40% in the last year , including dividends .
So let's assess the underlying fundamentals over the last 3 years and see if they've moved in lock-step with shareholder returns.
View our latest analysis for Viva Energy Group
There is no denying that markets are sometimes efficient, but prices do not always reflect underlying business performance. One imperfect but simple way to consider how the market perception of a company has shifted is to compare the change in the earnings per share (EPS) with the share price movement.
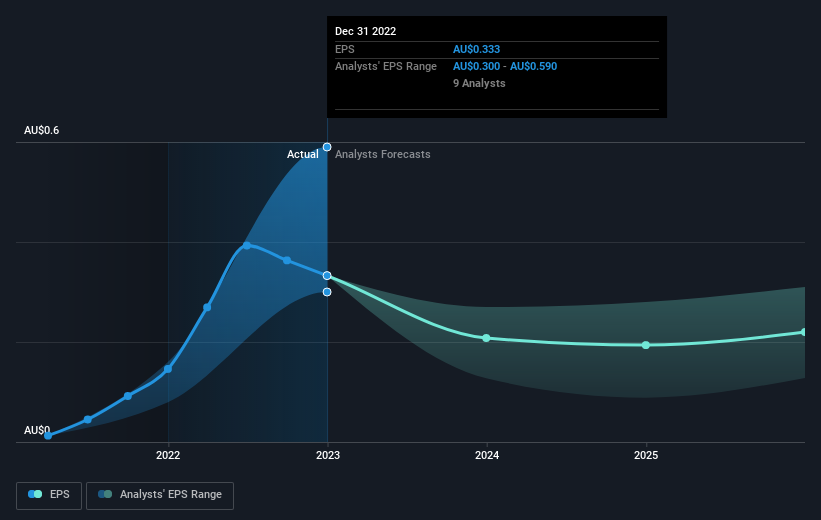
During three years of share price growth, Viva Energy Group achieved compound earnings per share growth of 67% per year. The average annual share price increase of 18% is actually lower than the EPS growth. Therefore, it seems the market has moderated its expectations for growth, somewhat. This cautious sentiment is reflected in its (fairly low) P/E ratio of 8.85.
The image below shows how EPS has tracked over time (if you click on the image you can see greater detail).
We know that Viva Energy Group has improved its bottom line over the last three years, but what does the future have in store? You can see how its balance sheet has strengthened (or weakened) over time in this free interactive graphic.
What About Dividends?
As well as measuring the share price return, investors should also consider the total shareholder return (TSR). The TSR incorporates the value of any spin-offs or discounted capital raisings, along with any dividends, based on the assumption that the dividends are reinvested. Arguably, the TSR gives a more comprehensive picture of the return generated by a stock. As it happens, Viva Energy Group's TSR for the last 3 years was 136%, which exceeds the share price return mentioned earlier. And there's no prize for guessing that the dividend payments largely explain the divergence!
A Different Perspective
Pleasingly, Viva Energy Group's total shareholder return last year was 40%. That includes the value of the dividend. So this year's TSR was actually better than the three-year TSR (annualized) of 33%. These improved returns may hint at some real business momentum, implying that now could be a great time to delve deeper. It's always interesting to track share price performance over the longer term. But to understand Viva Energy Group better, we need to consider many other factors. Case in point: We've spotted 2 warning signs for Viva Energy Group you should be aware of, and 1 of them makes us a bit uncomfortable.
We will like Viva Energy Group better if we see some big insider buys. While we wait, check out this free list of growing companies with considerable, recent, insider buying.
Please note, the market returns quoted in this article reflect the market weighted average returns of stocks that currently trade on Australian exchanges.
If you're looking to trade Viva Energy Group, open an account with the lowest-cost platform trusted by professionals, Interactive Brokers.
With clients in over 200 countries and territories, and access to 160 markets, IBKR lets you trade stocks, options, futures, forex, bonds and funds from a single integrated account.
Enjoy no hidden fees, no account minimums, and FX conversion rates as low as 0.03%, far better than what most brokers offer.
Sponsored ContentNew: Manage All Your Stock Portfolios in One Place
We've created the ultimate portfolio companion for stock investors, and it's free.
• Connect an unlimited number of Portfolios and see your total in one currency
• Be alerted to new Warning Signs or Risks via email or mobile
• Track the Fair Value of your stocks
Have feedback on this article? Concerned about the content? Get in touch with us directly. Alternatively, email editorial-team (at) simplywallst.com.
This article by Simply Wall St is general in nature. We provide commentary based on historical data and analyst forecasts only using an unbiased methodology and our articles are not intended to be financial advice. It does not constitute a recommendation to buy or sell any stock, and does not take account of your objectives, or your financial situation. We aim to bring you long-term focused analysis driven by fundamental data. Note that our analysis may not factor in the latest price-sensitive company announcements or qualitative material. Simply Wall St has no position in any stocks mentioned.
About ASX:VEA
Viva Energy Group
Operates as an energy company in Australia, Singapore, and Papua New Guinea.
Undervalued with reasonable growth potential.
Similar Companies
Market Insights

Community Narratives


