- Australia
- /
- Oil and Gas
- /
- ASX:MAY
Melbana Energy Limited's (ASX:MAY) Stock On An Uptrend: Could Fundamentals Be Driving The Momentum?


Melbana Energy (ASX:MAY) has had a great run on the share market with its stock up by a significant 77% over the last month. We wonder if and what role the company's financials play in that price change as a company's long-term fundamentals usually dictate market outcomes. Particularly, we will be paying attention to Melbana Energy's ROE today.
Return on Equity or ROE is a test of how effectively a company is growing its value and managing investors’ money. Simply put, it is used to assess the profitability of a company in relation to its equity capital.
Check out our latest analysis for Melbana Energy
How To Calculate Return On Equity?
The formula for return on equity is:
Return on Equity = Net Profit (from continuing operations) ÷ Shareholders' Equity
So, based on the above formula, the ROE for Melbana Energy is:
5.8% = AU$3.3m ÷ AU$56m (Based on the trailing twelve months to June 2024).
The 'return' is the yearly profit. That means that for every A$1 worth of shareholders' equity, the company generated A$0.06 in profit.
What Is The Relationship Between ROE And Earnings Growth?
Thus far, we have learned that ROE measures how efficiently a company is generating its profits. Depending on how much of these profits the company reinvests or "retains", and how effectively it does so, we are then able to assess a company’s earnings growth potential. Generally speaking, other things being equal, firms with a high return on equity and profit retention, have a higher growth rate than firms that don’t share these attributes.
Melbana Energy's Earnings Growth And 5.8% ROE
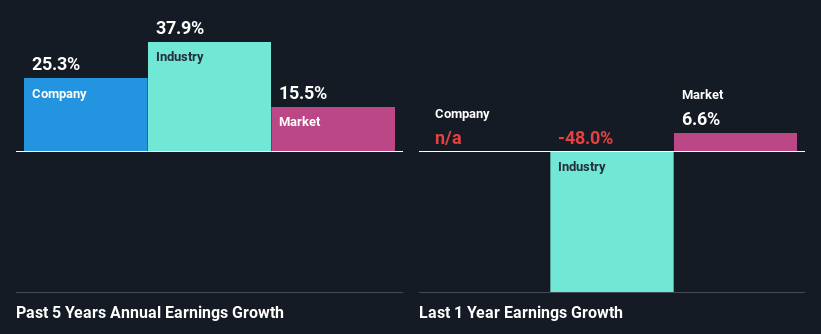
On the face of it, Melbana Energy's ROE is not much to talk about. A quick further study shows that the company's ROE doesn't compare favorably to the industry average of 15% either. Despite this, surprisingly, Melbana Energy saw an exceptional 25% net income growth over the past five years. We reckon that there could be other factors at play here. For example, it is possible that the company's management has made some good strategic decisions, or that the company has a low payout ratio.
We then compared Melbana Energy's net income growth with the industry and found that the company's growth figure is lower than the average industry growth rate of 38% in the same 5-year period, which is a bit concerning.
The basis for attaching value to a company is, to a great extent, tied to its earnings growth. What investors need to determine next is if the expected earnings growth, or the lack of it, is already built into the share price. This then helps them determine if the stock is placed for a bright or bleak future. One good indicator of expected earnings growth is the P/E ratio which determines the price the market is willing to pay for a stock based on its earnings prospects. So, you may want to check if Melbana Energy is trading on a high P/E or a low P/E, relative to its industry.
Is Melbana Energy Using Its Retained Earnings Effectively?
Melbana Energy doesn't pay any regular dividends to its shareholders, meaning that the company has been reinvesting all of its profits into the business. This is likely what's driving the high earnings growth number discussed above.
Conclusion
Overall, we feel that Melbana Energy certainly does have some positive factors to consider. Specifically, its fairly high earnings growth number, which no doubt was backed by the company's high earnings retention. Still, the low ROE means that all that reinvestment is not reaping a lot of benefit to the investors. While we won't completely dismiss the company, what we would do, is try to ascertain how risky the business is to make a more informed decision around the company. Our risks dashboard would have the 3 risks we have identified for Melbana Energy.
If you're looking to trade Melbana Energy, open an account with the lowest-cost platform trusted by professionals, Interactive Brokers.
With clients in over 200 countries and territories, and access to 160 markets, IBKR lets you trade stocks, options, futures, forex, bonds and funds from a single integrated account.
Enjoy no hidden fees, no account minimums, and FX conversion rates as low as 0.03%, far better than what most brokers offer.
Sponsored ContentNew: Manage All Your Stock Portfolios in One Place
We've created the ultimate portfolio companion for stock investors, and it's free.
• Connect an unlimited number of Portfolios and see your total in one currency
• Be alerted to new Warning Signs or Risks via email or mobile
• Track the Fair Value of your stocks
Have feedback on this article? Concerned about the content? Get in touch with us directly. Alternatively, email editorial-team (at) simplywallst.com.
This article by Simply Wall St is general in nature. We provide commentary based on historical data and analyst forecasts only using an unbiased methodology and our articles are not intended to be financial advice. It does not constitute a recommendation to buy or sell any stock, and does not take account of your objectives, or your financial situation. We aim to bring you long-term focused analysis driven by fundamental data. Note that our analysis may not factor in the latest price-sensitive company announcements or qualitative material. Simply Wall St has no position in any stocks mentioned.
About ASX:MAY
Melbana Energy
Engages in the oil and gas exploration business in Cuba and Australia.
Flawless balance sheet low.
