- Australia
- /
- Oil and Gas
- /
- ASX:HZN
Horizon Oil's (ASX:HZN) three-year earnings growth trails the 50% YoY shareholder returns


The worst result, after buying shares in a company (assuming no leverage), would be if you lose all the money you put in. But if you buy shares in a really great company, you can more than double your money. For instance the Horizon Oil Limited (ASX:HZN) share price is 105% higher than it was three years ago. How nice for those who held the stock! It's also up 16% in about a month.
After a strong gain in the past week, it's worth seeing if longer term returns have been driven by improving fundamentals.
See our latest analysis for Horizon Oil
To quote Buffett, 'Ships will sail around the world but the Flat Earth Society will flourish. There will continue to be wide discrepancies between price and value in the marketplace...' By comparing earnings per share (EPS) and share price changes over time, we can get a feel for how investor attitudes to a company have morphed over time.
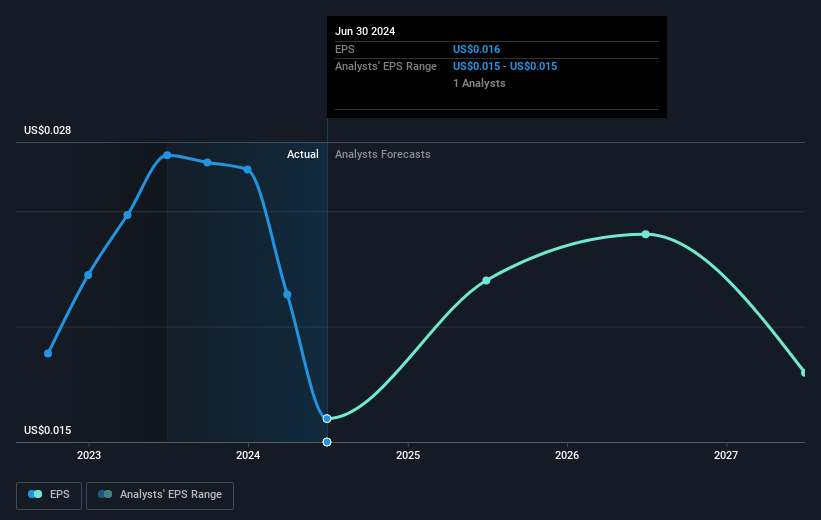
Horizon Oil was able to grow its EPS at 63% per year over three years, sending the share price higher. This EPS growth is higher than the 27% average annual increase in the share price. So one could reasonably conclude that the market has cooled on the stock. We'd venture the lowish P/E ratio of 9.23 also reflects the negative sentiment around the stock.
You can see below how EPS has changed over time (discover the exact values by clicking on the image).
It is of course excellent to see how Horizon Oil has grown profits over the years, but the future is more important for shareholders. If you are thinking of buying or selling Horizon Oil stock, you should check out this FREE detailed report on its balance sheet.
What About Dividends?
When looking at investment returns, it is important to consider the difference between total shareholder return (TSR) and share price return. The TSR is a return calculation that accounts for the value of cash dividends (assuming that any dividend received was reinvested) and the calculated value of any discounted capital raisings and spin-offs. So for companies that pay a generous dividend, the TSR is often a lot higher than the share price return. As it happens, Horizon Oil's TSR for the last 3 years was 238%, which exceeds the share price return mentioned earlier. This is largely a result of its dividend payments!
A Different Perspective
It's good to see that Horizon Oil has rewarded shareholders with a total shareholder return of 47% in the last twelve months. And that does include the dividend. That's better than the annualised return of 28% over half a decade, implying that the company is doing better recently. In the best case scenario, this may hint at some real business momentum, implying that now could be a great time to delve deeper. It's always interesting to track share price performance over the longer term. But to understand Horizon Oil better, we need to consider many other factors. For instance, we've identified 1 warning sign for Horizon Oil that you should be aware of.
If you like to buy stocks alongside management, then you might just love this free list of companies. (Hint: many of them are unnoticed AND have attractive valuation).
Please note, the market returns quoted in this article reflect the market weighted average returns of stocks that currently trade on Australian exchanges.
Valuation is complex, but we're here to simplify it.
Discover if Horizon Oil might be undervalued or overvalued with our detailed analysis, featuring fair value estimates, potential risks, dividends, insider trades, and its financial condition.
Access Free AnalysisHave feedback on this article? Concerned about the content? Get in touch with us directly. Alternatively, email editorial-team (at) simplywallst.com.
This article by Simply Wall St is general in nature. We provide commentary based on historical data and analyst forecasts only using an unbiased methodology and our articles are not intended to be financial advice. It does not constitute a recommendation to buy or sell any stock, and does not take account of your objectives, or your financial situation. We aim to bring you long-term focused analysis driven by fundamental data. Note that our analysis may not factor in the latest price-sensitive company announcements or qualitative material. Simply Wall St has no position in any stocks mentioned.
About ASX:HZN
Horizon Oil
Engages in the exploration, development, and production of oil and gas properties in China, New Zealand, and Australia.
Undervalued with excellent balance sheet.
Similar Companies
Market Insights

Community Narratives


