
Advertisement
- Australia
- /
- Oil and Gas
- /
- ASX:BMN
Why We Think Bannerman Energy Ltd's (ASX:BMN) CEO Compensation Is Not Excessive At All
Key Insights
- Bannerman Energy to hold its Annual General Meeting on 9th of November
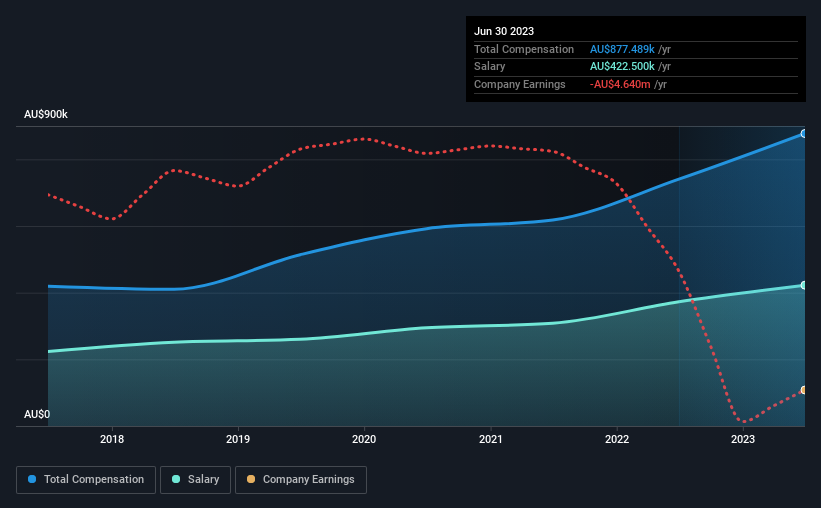
- Total pay for CEO Brandon Munro includes AU$422.5k salary
- The total compensation is similar to the average for the industry
- Bannerman Energy's total shareholder return over the past three years was 663% while its EPS was down 19% over the past three years
Performance at Bannerman Energy Ltd (ASX:BMN) has been reasonably good and CEO Brandon Munro has done a decent job of steering the company in the right direction. As shareholders go into the upcoming AGM on 9th of November, CEO compensation will probably not be their focus, but rather the steps management will take to continue the growth momentum. We present our case of why we think CEO compensation looks fair.
Check out our latest analysis for Bannerman Energy
Comparing Bannerman Energy Ltd's CEO Compensation With The Industry
At the time of writing, our data shows that Bannerman Energy Ltd has a market capitalization of AU$402m, and reported total annual CEO compensation of AU$877k for the year to June 2023. We note that's an increase of 19% above last year. While we always look at total compensation first, our analysis shows that the salary component is less, at AU$423k.
In comparison with other companies in the Australian Oil and Gas industry with market capitalizations ranging from AU$155m to AU$621m, the reported median CEO total compensation was AU$864k. So it looks like Bannerman Energy compensates Brandon Munro in line with the median for the industry. What's more, Brandon Munro holds AU$9.3m worth of shares in the company in their own name, indicating that they have a lot of skin in the game.
| Component | 2023 | 2022 | Proportion (2023) |
| Salary | AU$423k | AU$373k | 48% |
| Other | AU$455k | AU$368k | 52% |
| Total Compensation | AU$877k | AU$740k | 100% |
On an industry level, around 61% of total compensation represents salary and 39% is other remuneration. It's interesting to note that Bannerman Energy allocates a smaller portion of compensation to salary in comparison to the broader industry. If total compensation is slanted towards non-salary benefits, it indicates that CEO pay is linked to company performance.
A Look at Bannerman Energy Ltd's Growth Numbers
Over the last three years, Bannerman Energy Ltd has shrunk its earnings per share by 19% per year. It achieved revenue growth of 1,299% over the last year.
The decrease in EPS could be a concern for some investors. On the other hand, the strong revenue growth suggests the business is growing. These two metrics are moving in different directions, so while it's hard to be confident judging performance, we think the stock is worth watching. Moving away from current form for a second, it could be important to check this free visual depiction of what analysts expect for the future.
Has Bannerman Energy Ltd Been A Good Investment?
Boasting a total shareholder return of 663% over three years, Bannerman Energy Ltd has done well by shareholders. So they may not be at all concerned if the CEO were to be paid more than is normal for companies around the same size.
To Conclude...
Although the company has performed relatively well, we still think there are some areas that could be improved. We reckon that there are some shareholders who may be hesitant to increase CEO pay further until EPS growth starts to improve, despite the robust revenue growth.
CEO pay is simply one of the many factors that need to be considered while examining business performance. In our study, we found 3 warning signs for Bannerman Energy you should be aware of, and 2 of them don't sit too well with us.
Arguably, business quality is much more important than CEO compensation levels. So check out this free list of interesting companies that have HIGH return on equity and low debt.
Valuation is complex, but we're here to simplify it.
Discover if Bannerman Energy might be undervalued or overvalued with our detailed analysis, featuring fair value estimates, potential risks, dividends, insider trades, and its financial condition.
Access Free AnalysisHave feedback on this article? Concerned about the content? Get in touch with us directly. Alternatively, email editorial-team (at) simplywallst.com.
This article by Simply Wall St is general in nature. We provide commentary based on historical data and analyst forecasts only using an unbiased methodology and our articles are not intended to be financial advice. It does not constitute a recommendation to buy or sell any stock, and does not take account of your objectives, or your financial situation. We aim to bring you long-term focused analysis driven by fundamental data. Note that our analysis may not factor in the latest price-sensitive company announcements or qualitative material. Simply Wall St has no position in any stocks mentioned.
About ASX:BMN
Bannerman Energy
Engages in the exploration and development of uranium properties in Africa.
Excellent balance sheet with moderate growth potential.
Similar Companies
Market Insights

Advertisement
Community Narratives
MicroVision will explode future revenue by 380.37% with a vision towards success
Fair Value US$60|98.4% undervalued
TH
Community Contributor
The Indispensable Artery for a New North American Economy
Fair Value CA$132.87|0.7% overvalued
TI
Community Contributor
Recently Updated Narratives
CO

composite32 on Astor Enerji ·
Astor Enerji will surge with a fair value of $140.43 in the next 3 years
Fair Value:₺140.4335.5% undervalued
1 followerusers have followed this narrative
0 commentsusers have commented on this narrative
0 likesusers have liked this narrative
RE

RecMag on Proximus ·
Proximus: The State-Backed Backup Plan with 7% Gross Yield and 15% Currency Upside.
Fair Value:€17.1356.7% undervalued
29 followersusers have followed this narrative
0 commentsusers have commented on this narrative
0 likesusers have liked this narrative
AG


Agricola on IMPACT Silver ·
A case for for IMPACT Silver Corp (TSXV:IPT) to reach USD $4.52 (CAD $6.16) in 2026 (23 bagger in 1 year) and USD $5.76 (CAD $7.89) by 2030
Fair Value:CA$7.8996.2% undervalued
1 followerusers have followed this narrative
0 commentsusers have commented on this narrative
0 likesusers have liked this narrative
Popular Narratives
TH

TheWallstreetKing on MicroVision ·
MicroVision will explode future revenue by 380.37% with a vision towards success
Fair Value:US$6098.4% undervalued
101 followersusers have followed this narrative
10 commentsusers have commented on this narrative
20 likesusers have liked this narrative
OS


oscargarcia on Alphabet ·
The company that turned a verb into a global necessity and basically runs the modern internet, digital ads, smartphones, maps, and AI.
Fair Value:US$3405.8% undervalued
137 followersusers have followed this narrative
6 commentsusers have commented on this narrative
18 likesusers have liked this narrative
AN


AnalystConsensusTarget on NVIDIA ·
NVDA: Expanding AI Demand Will Drive Major Data Center Investments Through 2026
Fair Value:US$232.7924.0% undervalued
929 followersusers have followed this narrative
6 commentsusers have commented on this narrative
22 likesusers have liked this narrative