Advertisement
- Australia
- /
- Capital Markets
- /
- ASX:MQG
Macquarie Group’s Value in Focus Amid Interest Rate Shifts and Investor Optimism in 2025

Simply Wall St
Reviewed by Bailey Pemberton
Thinking about what to do with Macquarie Group shares? You’re not alone. With the stock closing recently at $222.16, current and future investors are weighing their options carefully. The past few years have been nothing short of a rollercoaster, with the stock rising a remarkable 101.3% over the last five years and 56.5% over three years. Even though the one-year return is down slightly at -0.5%, it has not stopped the stock from eking out positive results year to date, up 0.5%. In just the last week, shares have climbed 1.1% on the back of shifting market sentiment and broad investor optimism surrounding financials, while the last month saw more modest gains of 0.5%.
Why the attention now? Recent market developments, especially changing interest rate expectations and sector rotation into established institutions like Macquarie, have reignited debates about the group’s long-term growth potential and risk profile. The real question is whether the current price reflects fair value, or if there is more upside (or hidden risk) beneath the surface. On a straightforward valuation check, Macquarie Group’s value score stands at 2 out of 6, suggesting that it is only undervalued in two key areas and fairly priced or even overvalued in the rest.
Let’s break down how Macquarie Group’s valuation stacks up using some popular approaches. We will explore each one, so read on, because the most insightful way to look at valuation might surprise you at the end.
Macquarie Group scores just 2/6 on our valuation checks. See what other red flags we found in the full valuation breakdown.
Approach 1: Macquarie Group Excess Returns Analysis
The Excess Returns model takes a close look at how much return Macquarie Group generates on the capital that investors have put into the business, above and beyond its cost of equity. It is an insightful gauge of value creation, since companies that consistently generate returns greater than their cost of equity often justify premium share prices.
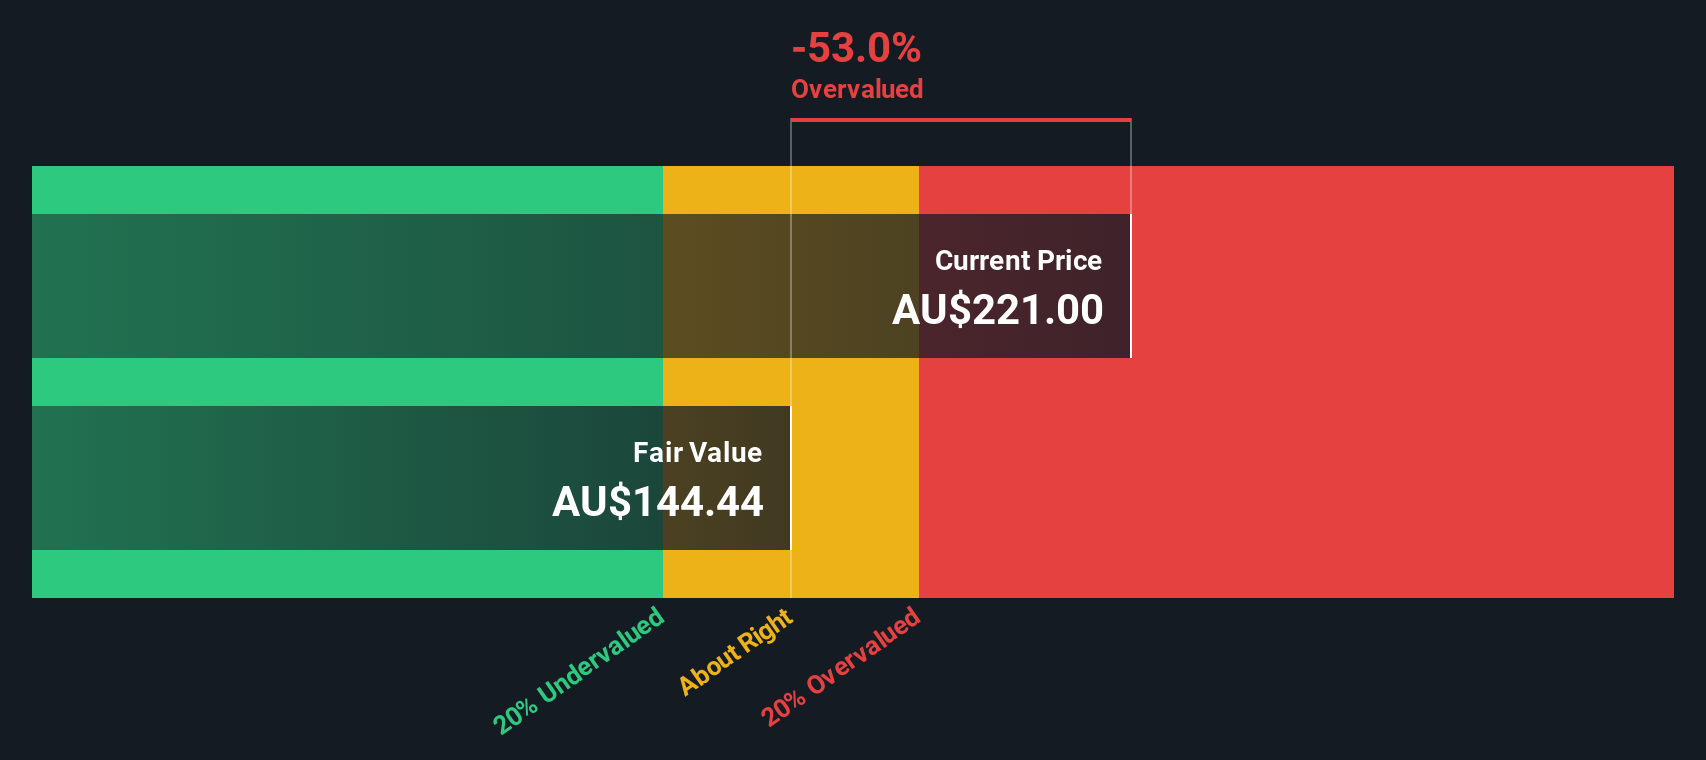
For Macquarie Group, the numbers tell an interesting story. The company’s Book Value per share stands at A$96.96, while its Stable Earnings Per Share (EPS) is A$11.98, based on weighted future Return on Equity estimates from 11 analysts. With a Cost of Equity at A$9.23 per share, the Excess Return, which is the difference between return achieved and cost incurred, is A$2.75 per share. Impressively, the average Return on Equity is 12.01%. The Stable Book Value, estimated by 7 analysts, is A$99.80 per share.
Applying these metrics, the Excess Returns framework estimates that Macquarie’s intrinsic value is significantly below the current share price. Specifically, the valuation implies the stock is around 53.5% overvalued at present levels.
Result: OVERVALUED
Our Excess Returns analysis suggests Macquarie Group may be overvalued by 53.5%. Find undervalued stocks or create your own screener to find better value opportunities.
Approach 2: Macquarie Group Price vs Earnings (P/E Ratio)
The Price-to-Earnings (P/E) ratio is one of the most widely used metrics for valuing consistently profitable companies like Macquarie Group. This ratio reflects how much investors are prepared to pay for each dollar of earnings, making it a strong indicator in sectors where steady profits are expected. Higher growth prospects or lower perceived risks typically justify a higher “normal” P/E ratio. In contrast, lower growth or higher risks warrant a lower ratio.
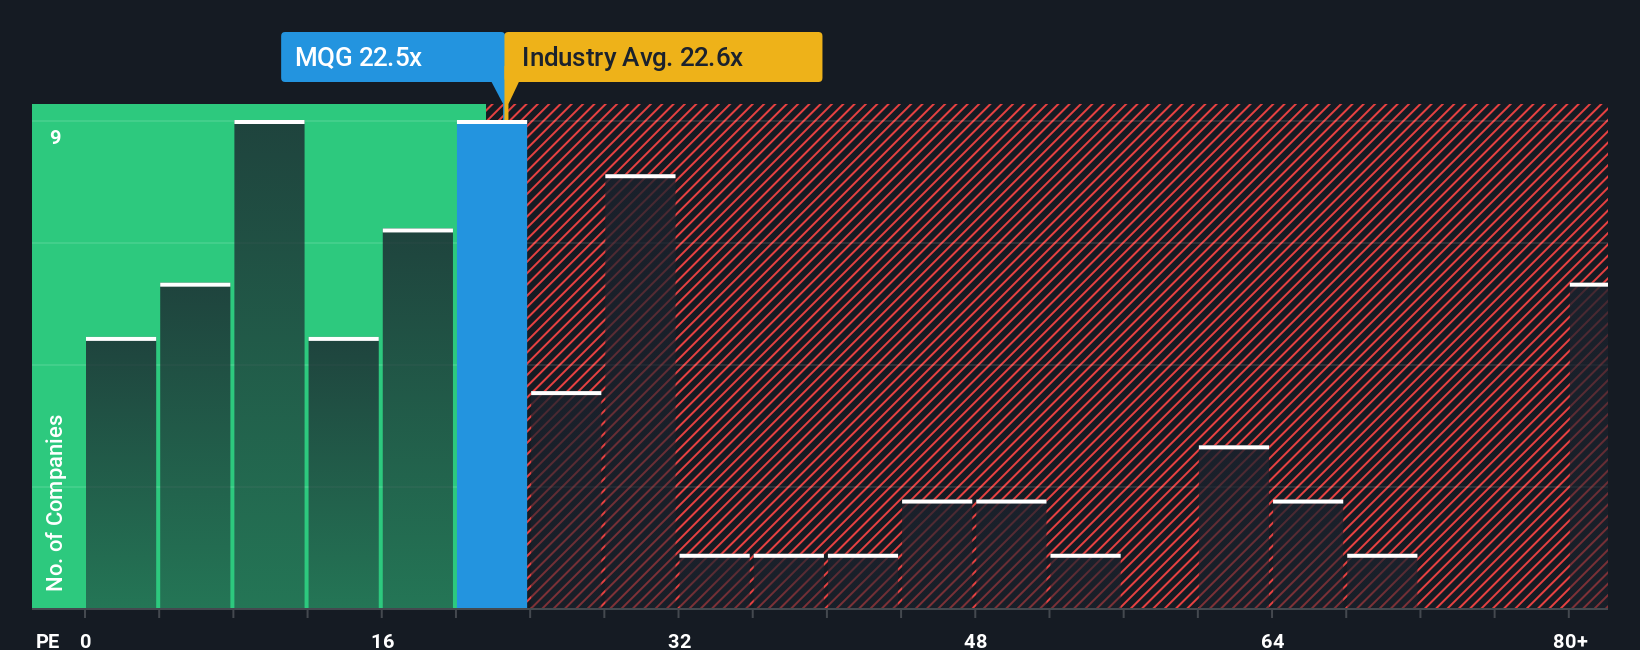
Currently, Macquarie Group trades on a P/E of 22.6x. This is very close to both the peer average of 23.0x and the broader Capital Markets industry average of 22.5x. While these benchmarks provide some context, they do not consider company-specific factors such as unique growth prospects or business risks.
That is where Simply Wall St’s proprietary “Fair Ratio” comes in. The Fair Ratio for Macquarie is estimated at 23.1x, calculated using an in-depth model that goes beyond surface-level comparisons. This methodology accounts for Macquarie’s earnings growth outlook, profit margins, industry segment, market capitalization, and risk profile, giving a more nuanced indication of the appropriate valuation multiple. Since Macquarie’s current P/E is nearly identical to its Fair Ratio, the stock appears to be priced about right by this method.
Result: ABOUT RIGHT
PE ratios tell one story, but what if the real opportunity lies elsewhere? Discover companies where insiders are betting big on explosive growth.
Upgrade Your Decision Making: Choose your Macquarie Group Narrative
Earlier, we mentioned that there is an even better way to understand valuation, so let us introduce you to Narratives. A Narrative goes beyond the numbers by allowing you to connect your own story or perspective on a company, such as your views on its future revenue, profit margins, and growth drivers, to a financial forecast and a calculated fair value. Narratives make the investing process more accessible and dynamic by letting you explore and build your assumptions easily using the Simply Wall St Community page, where millions of investors share their views.
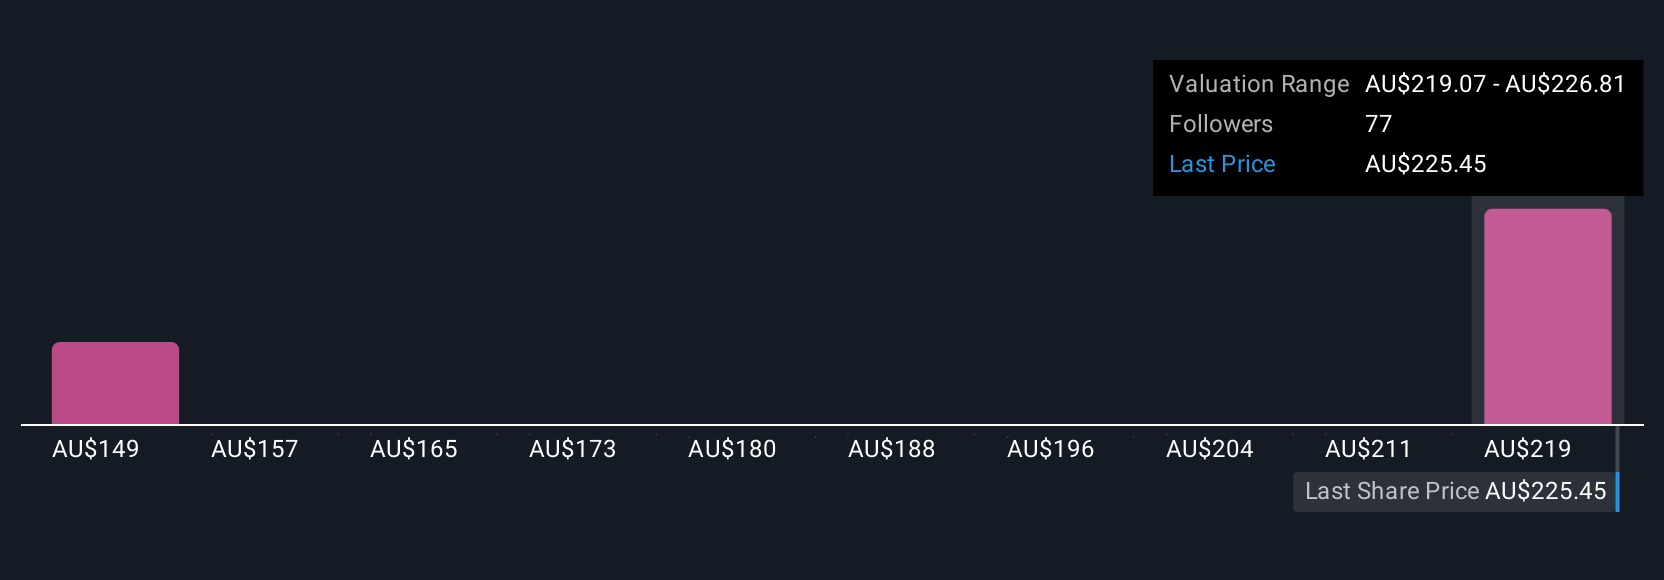
With Narratives, you can quickly see how your view on Macquarie Group compares to the market by matching your Fair Value with the current share price. This can help you decide if now is the right time to buy or sell. These Narratives also update automatically as new data or company news comes in, keeping your view current. For example, some investors see Macquarie’s heavy investment in digitization and green projects as key reasons for a higher future price target of A$250.0, while others are cautious about margin pressures and market volatility, resulting in a lower target of A$195.0. Narratives allow you to follow your own logic and respond with confidence as the facts change.
Do you think there's more to the story for Macquarie Group? Create your own Narrative to let the Community know!
This article by Simply Wall St is general in nature. We provide commentary based on historical data and analyst forecasts only using an unbiased methodology and our articles are not intended to be financial advice. It does not constitute a recommendation to buy or sell any stock, and does not take account of your objectives, or your financial situation. We aim to bring you long-term focused analysis driven by fundamental data. Note that our analysis may not factor in the latest price-sensitive company announcements or qualitative material. Simply Wall St has no position in any stocks mentioned.
New: Manage All Your Stock Portfolios in One Place
We've created the ultimate portfolio companion for stock investors, and it's free.
• Connect an unlimited number of Portfolios and see your total in one currency
• Be alerted to new Warning Signs or Risks via email or mobile
• Track the Fair Value of your stocks
Have feedback on this article? Concerned about the content? Get in touch with us directly. Alternatively, email editorial-team@simplywallst.com
About ASX:MQG
Macquarie Group
Provides diversified financial services in Australia, New Zealand the Americas, Europe, the Middle East, Africa, and Asia.
Adequate balance sheet average dividend payer.
Similar Companies
Market Insights

Advertisement
Community Narratives
A formidable player in AI and enterprise computing.
Fair Value US$210.00|12.2% overvalued
CO
Community Contributor
IREN's Bold Moves in Sustainable Bitcoin Mining & AI Data Centers
Fair Value US$72.52|17.1% undervalued
BL
Community Contributor
Cooling the Champions: The Aussie Tech Behind F1's Victories
Fair Value AU$12.40|38.1% undervalued
TR
Community Contributor