
Advertisement
- Australia
- /
- Consumer Finance
- /
- ASX:LFS
Shareholders 27% loss in Latitude Group Holdings (ASX:LFS) partly attributable to the company's decline in earnings over past year

Investors can approximate the average market return by buying an index fund. But if you buy individual stocks, you can do both better or worse than that. For example, the Latitude Group Holdings Limited (ASX:LFS) share price is down 34% in the last year. That falls noticeably short of the market decline of around 1.6%. Because Latitude Group Holdings hasn't been listed for many years, the market is still learning about how the business performs.
On a more encouraging note the company has added AU$78m to its market cap in just the last 7 days, so let's see if we can determine what's driven the one-year loss for shareholders.
View our latest analysis for Latitude Group Holdings
In his essay The Superinvestors of Graham-and-Doddsville Warren Buffett described how share prices do not always rationally reflect the value of a business. One way to examine how market sentiment has changed over time is to look at the interaction between a company's share price and its earnings per share (EPS).
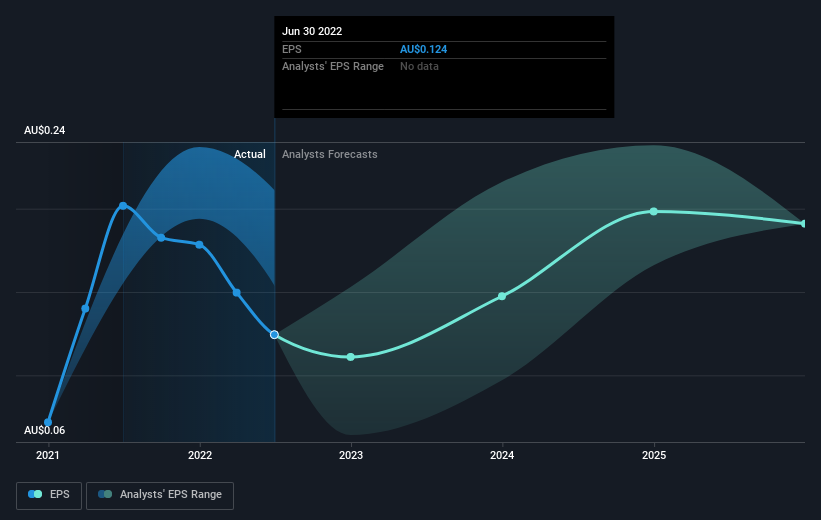
Unhappily, Latitude Group Holdings had to report a 38% decline in EPS over the last year. This proportional reduction in earnings per share isn't far from the 34% decrease in the share price. Given the lower EPS we might have expected investors to lose confidence in the stock, but that doesn't seemed to have happened. Rather, the share price is remains a similar multiple of the EPS, suggesting the outlook remains the same.
The image below shows how EPS has tracked over time (if you click on the image you can see greater detail).
We like that insiders have been buying shares in the last twelve months. Even so, future earnings will be far more important to whether current shareholders make money. This free interactive report on Latitude Group Holdings' earnings, revenue and cash flow is a great place to start, if you want to investigate the stock further.
What About Dividends?
As well as measuring the share price return, investors should also consider the total shareholder return (TSR). Whereas the share price return only reflects the change in the share price, the TSR includes the value of dividends (assuming they were reinvested) and the benefit of any discounted capital raising or spin-off. It's fair to say that the TSR gives a more complete picture for stocks that pay a dividend. We note that for Latitude Group Holdings the TSR over the last 1 year was -27%, which is better than the share price return mentioned above. This is largely a result of its dividend payments!
A Different Perspective
We doubt Latitude Group Holdings shareholders are happy with the loss of 27% over twelve months (even including dividends). That falls short of the market, which lost 1.6%. There's no doubt that's a disappointment, but the stock may well have fared better in a stronger market. Putting aside the last twelve months, it's good to see the share price has rebounded by 7.0%, in the last ninety days. This could just be a bounce because the selling was too aggressive, but fingers crossed it's the start of a new trend. I find it very interesting to look at share price over the long term as a proxy for business performance. But to truly gain insight, we need to consider other information, too. For instance, we've identified 2 warning signs for Latitude Group Holdings (1 makes us a bit uncomfortable) that you should be aware of.
If you like to buy stocks alongside management, then you might just love this free list of companies. (Hint: insiders have been buying them).
Please note, the market returns quoted in this article reflect the market weighted average returns of stocks that currently trade on AU exchanges.
New: AI Stock Screener & Alerts
Our new AI Stock Screener scans the market every day to uncover opportunities.
• Dividend Powerhouses (3%+ Yield)
• Undervalued Small Caps with Insider Buying
• High growth Tech and AI Companies
Or build your own from over 50 metrics.
Have feedback on this article? Concerned about the content? Get in touch with us directly. Alternatively, email editorial-team (at) simplywallst.com.
This article by Simply Wall St is general in nature. We provide commentary based on historical data and analyst forecasts only using an unbiased methodology and our articles are not intended to be financial advice. It does not constitute a recommendation to buy or sell any stock, and does not take account of your objectives, or your financial situation. We aim to bring you long-term focused analysis driven by fundamental data. Note that our analysis may not factor in the latest price-sensitive company announcements or qualitative material. Simply Wall St has no position in any stocks mentioned.
About ASX:LFS
Latitude Group Holdings
Engages in sales finance and consumer lending business in Australia, New Zealand, and internationally.
Reasonable growth potential with mediocre balance sheet.
Similar Companies
Market Insights

Advertisement
Community Narratives
Groundbreaking therapies that could change the treatment landscape for PTSD, fibromyalgia, MS & Alzheimer’s
Fair Value US$6.20|86.9% undervalued
CM
Community Contributor
DigitalOcean Will Grow 14% by Embracing AI with Paperspace Acquisition
Fair Value US$50.00|40.2% undervalued
NE
Community Contributor
Viant Technology: A Rising AdTech Challenger in the AI-Powered CTV Market
Fair Value US$38.61|62.7% undervalued
BL
Community Contributor
Volvo will Accelerate Forward into Electric and Autonomous Leadership in Five Years
Fair Value SEK 438.80|40.1% undervalued
UN
Community Contributor