
Advertisement
Howard Marks put it nicely when he said that, rather than worrying about share price volatility, 'The possibility of permanent loss is the risk I worry about... and every practical investor I know worries about.' So it might be obvious that you need to consider debt, when you think about how risky any given stock is, because too much debt can sink a company. As with many other companies xReality Group Limited (ASX:XRG) makes use of debt. But the real question is whether this debt is making the company risky.
What Risk Does Debt Bring?
Debt assists a business until the business has trouble paying it off, either with new capital or with free cash flow. In the worst case scenario, a company can go bankrupt if it cannot pay its creditors. While that is not too common, we often do see indebted companies permanently diluting shareholders because lenders force them to raise capital at a distressed price. Of course, the upside of debt is that it often represents cheap capital, especially when it replaces dilution in a company with the ability to reinvest at high rates of return. When we examine debt levels, we first consider both cash and debt levels, together.
Check out our latest analysis for xReality Group
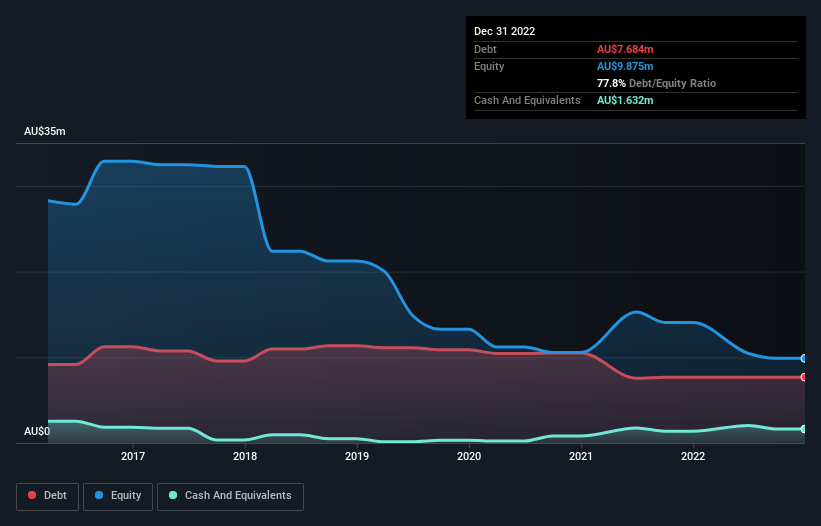
How Much Debt Does xReality Group Carry?
As you can see below, xReality Group had AU$7.68m of debt, at December 2022, which is about the same as the year before. You can click the chart for greater detail. However, it does have AU$1.63m in cash offsetting this, leading to net debt of about AU$6.05m.
How Strong Is xReality Group's Balance Sheet?
We can see from the most recent balance sheet that xReality Group had liabilities of AU$5.65m falling due within a year, and liabilities of AU$22.1m due beyond that. Offsetting these obligations, it had cash of AU$1.63m as well as receivables valued at AU$1.29m due within 12 months. So its liabilities total AU$24.8m more than the combination of its cash and short-term receivables.
When you consider that this deficiency exceeds the company's AU$18.7m market capitalization, you might well be inclined to review the balance sheet intently. Hypothetically, extremely heavy dilution would be required if the company were forced to pay down its liabilities by raising capital at the current share price. There's no doubt that we learn most about debt from the balance sheet. But it is xReality Group's earnings that will influence how the balance sheet holds up in the future. So when considering debt, it's definitely worth looking at the earnings trend. Click here for an interactive snapshot.
Over 12 months, xReality Group reported revenue of AU$9.1m, which is a gain of 48%, although it did not report any earnings before interest and tax. Shareholders probably have their fingers crossed that it can grow its way to profits.
Caveat Emptor
Even though xReality Group managed to grow its top line quite deftly, the cold hard truth is that it is losing money on the EBIT line. Indeed, it lost a very considerable AU$2.1m at the EBIT level. When we look at that alongside the significant liabilities, we're not particularly confident about the company. It would need to improve its operations quickly for us to be interested in it. It's fair to say the loss of AU$6.6m didn't encourage us either; we'd like to see a profit. In the meantime, we consider the stock to be risky. The balance sheet is clearly the area to focus on when you are analysing debt. However, not all investment risk resides within the balance sheet - far from it. To that end, you should be aware of the 2 warning signs we've spotted with xReality Group .
If you're interested in investing in businesses that can grow profits without the burden of debt, then check out this free list of growing businesses that have net cash on the balance sheet.
Valuation is complex, but we're here to simplify it.
Discover if xReality Group might be undervalued or overvalued with our detailed analysis, featuring fair value estimates, potential risks, dividends, insider trades, and its financial condition.
Access Free AnalysisHave feedback on this article? Concerned about the content? Get in touch with us directly. Alternatively, email editorial-team (at) simplywallst.com.
This article by Simply Wall St is general in nature. We provide commentary based on historical data and analyst forecasts only using an unbiased methodology and our articles are not intended to be financial advice. It does not constitute a recommendation to buy or sell any stock, and does not take account of your objectives, or your financial situation. We aim to bring you long-term focused analysis driven by fundamental data. Note that our analysis may not factor in the latest price-sensitive company announcements or qualitative material. Simply Wall St has no position in any stocks mentioned.
About ASX:XRG
xReality Group
Develops and operates physical and digital simulations in the Asia Pacific and the United States.
Adequate balance sheet with slight risk.
Market Insights

Advertisement
Community Narratives
A formidable player in AI and enterprise computing.
Fair Value US$210.00|2.3% overvalued
CO
Community Contributor
IREN's Bold Moves in Sustainable Bitcoin Mining & AI Data Centers
Fair Value US$72.52|17.6% undervalued
BL
Community Contributor
Cooling the Champions: The Aussie Tech Behind F1's Victories
Fair Value AU$12.40|40.4% undervalued
TR
Community Contributor