- Australia
- /
- Hospitality
- /
- ASX:SGR
Investors in Star Entertainment Group (ASX:SGR) from five years ago are still down 86%, even after 12% gain this past week


The Star Entertainment Group Limited (ASX:SGR) shareholders should be happy to see the share price up 19% in the last month. But will that heal all the wounds inflicted over 5 years of declines? Unlikely. Five years have seen the share price descend precipitously, down a full 89%. It's true that the recent bounce could signal the company is turning over a new leaf, but we are not so sure. The million dollar question is whether the company can justify a long term recovery. We really feel for shareholders in this scenario. It's a good reminder of the importance of diversification, and it's worth keeping in mind there's more to life than money, anyway.
On a more encouraging note the company has added AU$158m to its market cap in just the last 7 days, so let's see if we can determine what's driven the five-year loss for shareholders.
Check out our latest analysis for Star Entertainment Group
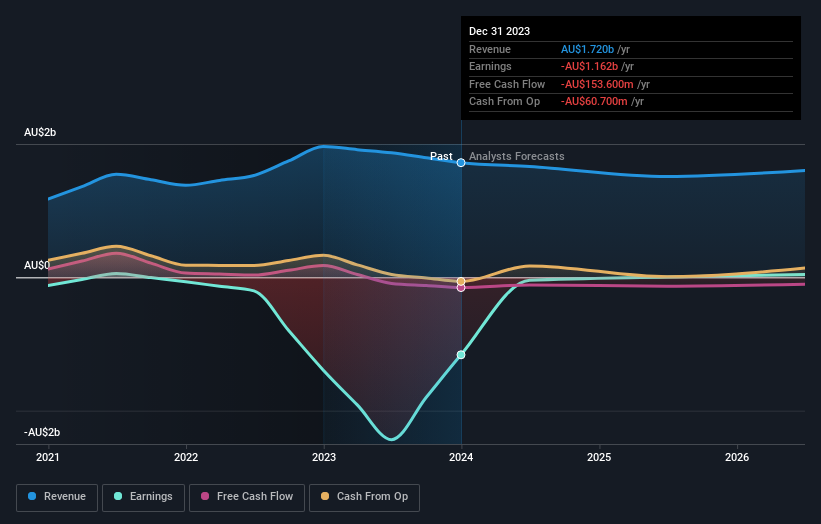
Given that Star Entertainment Group didn't make a profit in the last twelve months, we'll focus on revenue growth to form a quick view of its business development. Shareholders of unprofitable companies usually desire strong revenue growth. As you can imagine, fast revenue growth, when maintained, often leads to fast profit growth.
Over half a decade Star Entertainment Group reduced its trailing twelve month revenue by 3.7% for each year. That's not what investors generally want to see. The share price fall of 14% (per year, over five years) is a stern reminder that money-losing companies are expected to grow revenue. We're generally averse to companies with declining revenues, but we're not alone in that. That is not really what the successful investors we know aim for.
The image below shows how earnings and revenue have tracked over time (if you click on the image you can see greater detail).
It's probably worth noting we've seen significant insider buying in the last quarter, which we consider a positive. On the other hand, we think the revenue and earnings trends are much more meaningful measures of the business. So we recommend checking out this free report showing consensus forecasts
What About The Total Shareholder Return (TSR)?
We've already covered Star Entertainment Group's share price action, but we should also mention its total shareholder return (TSR). The TSR is a return calculation that accounts for the value of cash dividends (assuming that any dividend received was reinvested) and the calculated value of any discounted capital raisings and spin-offs. Dividends have been really beneficial for Star Entertainment Group shareholders, and that cash payout explains why its total shareholder loss of 86%, over the last 5 years, isn't as bad as the share price return.
A Different Perspective
Star Entertainment Group shareholders are down 53% for the year, but the market itself is up 13%. Even the share prices of good stocks drop sometimes, but we want to see improvements in the fundamental metrics of a business, before getting too interested. Unfortunately, last year's performance may indicate unresolved challenges, given that it was worse than the annualised loss of 13% over the last half decade. Generally speaking long term share price weakness can be a bad sign, though contrarian investors might want to research the stock in hope of a turnaround. I find it very interesting to look at share price over the long term as a proxy for business performance. But to truly gain insight, we need to consider other information, too. Take risks, for example - Star Entertainment Group has 1 warning sign we think you should be aware of.
Star Entertainment Group is not the only stock that insiders are buying. For those who like to find lesser know companies this free list of growing companies with recent insider purchasing, could be just the ticket.
Please note, the market returns quoted in this article reflect the market weighted average returns of stocks that currently trade on Australian exchanges.
New: Manage All Your Stock Portfolios in One Place
We've created the ultimate portfolio companion for stock investors, and it's free.
• Connect an unlimited number of Portfolios and see your total in one currency
• Be alerted to new Warning Signs or Risks via email or mobile
• Track the Fair Value of your stocks
Have feedback on this article? Concerned about the content? Get in touch with us directly. Alternatively, email editorial-team (at) simplywallst.com.
This article by Simply Wall St is general in nature. We provide commentary based on historical data and analyst forecasts only using an unbiased methodology and our articles are not intended to be financial advice. It does not constitute a recommendation to buy or sell any stock, and does not take account of your objectives, or your financial situation. We aim to bring you long-term focused analysis driven by fundamental data. Note that our analysis may not factor in the latest price-sensitive company announcements or qualitative material. Simply Wall St has no position in any stocks mentioned.
About ASX:SGR
Star Entertainment Group
Operates and manages integrated resorts in Australia.
Undervalued with adequate balance sheet.
Similar Companies
Market Insights

Community Narratives


