- Australia
- /
- Food and Staples Retail
- /
- ASX:GNC
Earnings growth outpaced the strong 27% CAGR delivered to GrainCorp (ASX:GNC) shareholders over the last three years

By buying an index fund, investors can approximate the average market return. But if you buy good businesses at attractive prices, your portfolio returns could exceed the average market return. For example, GrainCorp Limited (ASX:GNC) shareholders have seen the share price rise 75% over three years, well in excess of the market return (7.9%, not including dividends). On the other hand, the returns haven't been quite so good recently, with shareholders up just 15%, including dividends.
Since it's been a strong week for GrainCorp shareholders, let's have a look at trend of the longer term fundamentals.
See our latest analysis for GrainCorp
In his essay The Superinvestors of Graham-and-Doddsville Warren Buffett described how share prices do not always rationally reflect the value of a business. By comparing earnings per share (EPS) and share price changes over time, we can get a feel for how investor attitudes to a company have morphed over time.
GrainCorp was able to grow its EPS at 134% per year over three years, sending the share price higher. The average annual share price increase of 21% is actually lower than the EPS growth. Therefore, it seems the market has moderated its expectations for growth, somewhat.
The graphic below depicts how EPS has changed over time (unveil the exact values by clicking on the image).
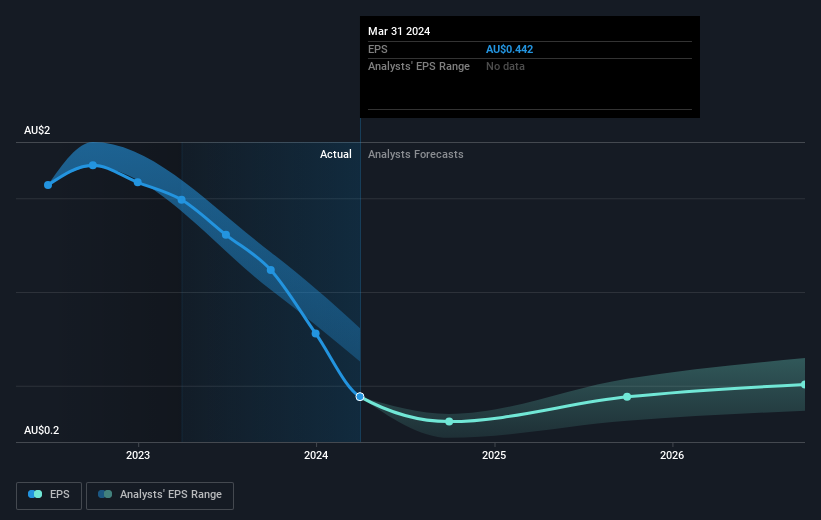
It is of course excellent to see how GrainCorp has grown profits over the years, but the future is more important for shareholders. Take a more thorough look at GrainCorp's financial health with this free report on its balance sheet.
What About Dividends?
As well as measuring the share price return, investors should also consider the total shareholder return (TSR). The TSR incorporates the value of any spin-offs or discounted capital raisings, along with any dividends, based on the assumption that the dividends are reinvested. It's fair to say that the TSR gives a more complete picture for stocks that pay a dividend. We note that for GrainCorp the TSR over the last 3 years was 106%, which is better than the share price return mentioned above. This is largely a result of its dividend payments!
A Different Perspective
It's good to see that GrainCorp has rewarded shareholders with a total shareholder return of 15% in the last twelve months. And that does include the dividend. Having said that, the five-year TSR of 21% a year, is even better. It's always interesting to track share price performance over the longer term. But to understand GrainCorp better, we need to consider many other factors. Consider for instance, the ever-present spectre of investment risk. We've identified 3 warning signs with GrainCorp (at least 1 which is a bit concerning) , and understanding them should be part of your investment process.
We will like GrainCorp better if we see some big insider buys. While we wait, check out this free list of undervalued stocks (mostly small caps) with considerable, recent, insider buying.
Please note, the market returns quoted in this article reflect the market weighted average returns of stocks that currently trade on Australian exchanges.
If you're looking to trade GrainCorp, open an account with the lowest-cost platform trusted by professionals, Interactive Brokers.
With clients in over 200 countries and territories, and access to 160 markets, IBKR lets you trade stocks, options, futures, forex, bonds and funds from a single integrated account.
Enjoy no hidden fees, no account minimums, and FX conversion rates as low as 0.03%, far better than what most brokers offer.
Sponsored ContentNew: Manage All Your Stock Portfolios in One Place
We've created the ultimate portfolio companion for stock investors, and it's free.
• Connect an unlimited number of Portfolios and see your total in one currency
• Be alerted to new Warning Signs or Risks via email or mobile
• Track the Fair Value of your stocks
Have feedback on this article? Concerned about the content? Get in touch with us directly. Alternatively, email editorial-team (at) simplywallst.com.
This article by Simply Wall St is general in nature. We provide commentary based on historical data and analyst forecasts only using an unbiased methodology and our articles are not intended to be financial advice. It does not constitute a recommendation to buy or sell any stock, and does not take account of your objectives, or your financial situation. We aim to bring you long-term focused analysis driven by fundamental data. Note that our analysis may not factor in the latest price-sensitive company announcements or qualitative material. Simply Wall St has no position in any stocks mentioned.
About ASX:GNC
GrainCorp
Operates as an agribusiness and processing company in Australasia, Asia, North America, and Europe.
Adequate balance sheet and fair value.
Similar Companies
Market Insights

Community Narratives

