- Australia
- /
- Food and Staples Retail
- /
- ASX:COL
Coles Group (ASX:COL) May Have Issues Allocating Its Capital


If you're not sure where to start when looking for the next multi-bagger, there are a few key trends you should keep an eye out for. In a perfect world, we'd like to see a company investing more capital into its business and ideally the returns earned from that capital are also increasing. Put simply, these types of businesses are compounding machines, meaning they are continually reinvesting their earnings at ever-higher rates of return. However, after investigating Coles Group (ASX:COL), we don't think it's current trends fit the mold of a multi-bagger.
Return On Capital Employed (ROCE): What Is It?
For those that aren't sure what ROCE is, it measures the amount of pre-tax profits a company can generate from the capital employed in its business. To calculate this metric for Coles Group, this is the formula:
Return on Capital Employed = Earnings Before Interest and Tax (EBIT) ÷ (Total Assets - Current Liabilities)
0.14 = AU$1.7b ÷ (AU$19b - AU$7.1b) (Based on the trailing twelve months to December 2023).
So, Coles Group has an ROCE of 14%. That's a relatively normal return on capital, and it's around the 11% generated by the Consumer Retailing industry.
Check out our latest analysis for Coles Group
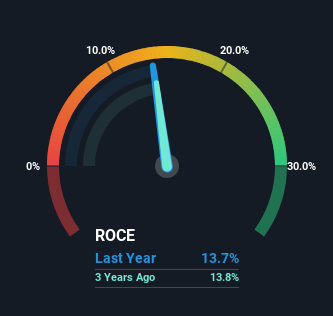
Above you can see how the current ROCE for Coles Group compares to its prior returns on capital, but there's only so much you can tell from the past. If you'd like, you can check out the forecasts from the analysts covering Coles Group for free.
The Trend Of ROCE
When we looked at the ROCE trend at Coles Group, we didn't gain much confidence. To be more specific, ROCE has fallen from 24% over the last five years. On the other hand, the company has been employing more capital without a corresponding improvement in sales in the last year, which could suggest these investments are longer term plays. It may take some time before the company starts to see any change in earnings from these investments.
On a related note, Coles Group has decreased its current liabilities to 36% of total assets. So we could link some of this to the decrease in ROCE. What's more, this can reduce some aspects of risk to the business because now the company's suppliers or short-term creditors are funding less of its operations. Since the business is basically funding more of its operations with it's own money, you could argue this has made the business less efficient at generating ROCE.
Our Take On Coles Group's ROCE
To conclude, we've found that Coles Group is reinvesting in the business, but returns have been falling. Since the stock has gained an impressive 53% over the last five years, investors must think there's better things to come. However, unless these underlying trends turn more positive, we wouldn't get our hopes up too high.
Coles Group does have some risks though, and we've spotted 1 warning sign for Coles Group that you might be interested in.
While Coles Group may not currently earn the highest returns, we've compiled a list of companies that currently earn more than 25% return on equity. Check out this free list here.
New: AI Stock Screener & Alerts
Our new AI Stock Screener scans the market every day to uncover opportunities.
• Dividend Powerhouses (3%+ Yield)
• Undervalued Small Caps with Insider Buying
• High growth Tech and AI Companies
Or build your own from over 50 metrics.
Have feedback on this article? Concerned about the content? Get in touch with us directly. Alternatively, email editorial-team (at) simplywallst.com.
This article by Simply Wall St is general in nature. We provide commentary based on historical data and analyst forecasts only using an unbiased methodology and our articles are not intended to be financial advice. It does not constitute a recommendation to buy or sell any stock, and does not take account of your objectives, or your financial situation. We aim to bring you long-term focused analysis driven by fundamental data. Note that our analysis may not factor in the latest price-sensitive company announcements or qualitative material. Simply Wall St has no position in any stocks mentioned.
About ASX:COL
Solid track record with mediocre balance sheet.
Similar Companies
Market Insights

Community Narratives

