- Australia
- /
- Consumer Durables
- /
- ASX:FWD
Fleetwood Limited's (ASX:FWD) Dismal Stock Performance Reflects Weak Fundamentals

Fleetwood (ASX:FWD) has had a rough week with its share price down 12%. To decide if this trend could continue, we decided to look at its weak fundamentals as they shape the long-term market trends. In this article, we decided to focus on Fleetwood's ROE.
ROE or return on equity is a useful tool to assess how effectively a company can generate returns on the investment it received from its shareholders. In short, ROE shows the profit each dollar generates with respect to its shareholder investments.
View our latest analysis for Fleetwood
How To Calculate Return On Equity?
Return on equity can be calculated by using the formula:
Return on Equity = Net Profit (from continuing operations) ÷ Shareholders' Equity
So, based on the above formula, the ROE for Fleetwood is:
4.0% = AU$6.7m ÷ AU$168m (Based on the trailing twelve months to December 2023).
The 'return' is the amount earned after tax over the last twelve months. Another way to think of that is that for every A$1 worth of equity, the company was able to earn A$0.04 in profit.
What Has ROE Got To Do With Earnings Growth?
Thus far, we have learned that ROE measures how efficiently a company is generating its profits. Based on how much of its profits the company chooses to reinvest or "retain", we are then able to evaluate a company's future ability to generate profits. Assuming all else is equal, companies that have both a higher return on equity and higher profit retention are usually the ones that have a higher growth rate when compared to companies that don't have the same features.
Fleetwood's Earnings Growth And 4.0% ROE
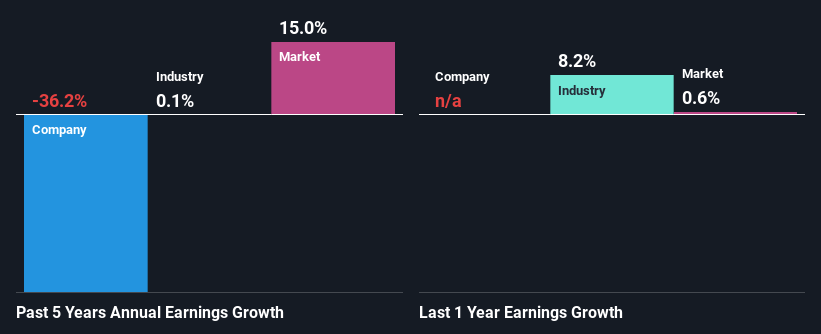
It is hard to argue that Fleetwood's ROE is much good in and of itself. Even when compared to the industry average of 14%, the ROE figure is pretty disappointing. For this reason, Fleetwood's five year net income decline of 36% is not surprising given its lower ROE. We reckon that there could also be other factors at play here. For instance, the company has a very high payout ratio, or is faced with competitive pressures.
That being said, we compared Fleetwood's performance with the industry and were concerned when we found that while the company has shrunk its earnings, the industry has grown its earnings at a rate of 0.1% in the same 5-year period.
Earnings growth is an important metric to consider when valuing a stock. What investors need to determine next is if the expected earnings growth, or the lack of it, is already built into the share price. Doing so will help them establish if the stock's future looks promising or ominous. Is Fleetwood fairly valued compared to other companies? These 3 valuation measures might help you decide.
Is Fleetwood Efficiently Re-investing Its Profits?
Fleetwood has a high LTM (or last twelve month) payout ratio of 66% (that is, it is retaining 34% of its profits). This suggests that the company is paying most of its profits as dividends to its shareholders. This goes some way in explaining why its earnings have been shrinking. With only a little being reinvested into the business, earnings growth would obviously be low or non-existent.
In addition, Fleetwood has been paying dividends over a period of at least ten years suggesting that keeping up dividend payments is way more important to the management even if it comes at the cost of business growth. Looking at the current analyst consensus data, we can see that the company's future payout ratio is expected to rise to 100% over the next three years. Regardless, the future ROE for Fleetwood is speculated to rise to 14% despite the anticipated increase in the payout ratio. There could probably be other factors that could be driving the future growth in the ROE.
Summary
Overall, we would be extremely cautious before making any decision on Fleetwood. As a result of its low ROE and lack of much reinvestment into the business, the company has seen a disappointing earnings growth rate. That being so, the latest industry analyst forecasts show that the analysts are expecting to see a huge improvement in the company's earnings growth rate. To know more about the latest analysts predictions for the company, check out this visualization of analyst forecasts for the company.
New: AI Stock Screener & Alerts
Our new AI Stock Screener scans the market every day to uncover opportunities.
• Dividend Powerhouses (3%+ Yield)
• Undervalued Small Caps with Insider Buying
• High growth Tech and AI Companies
Or build your own from over 50 metrics.
Have feedback on this article? Concerned about the content? Get in touch with us directly. Alternatively, email editorial-team (at) simplywallst.com.
This article by Simply Wall St is general in nature. We provide commentary based on historical data and analyst forecasts only using an unbiased methodology and our articles are not intended to be financial advice. It does not constitute a recommendation to buy or sell any stock, and does not take account of your objectives, or your financial situation. We aim to bring you long-term focused analysis driven by fundamental data. Note that our analysis may not factor in the latest price-sensitive company announcements or qualitative material. Simply Wall St has no position in any stocks mentioned.
About ASX:FWD
Fleetwood
Engages in the design, manufacture, sale, and installation of modular accommodation and buildings in Australia and New Zealand.
Flawless balance sheet with solid track record.
Similar Companies
Market Insights

Community Narratives


