

Legendary fund manager Li Lu (who Charlie Munger backed) once said, 'The biggest investment risk is not the volatility of prices, but whether you will suffer a permanent loss of capital.' So it might be obvious that you need to consider debt, when you think about how risky any given stock is, because too much debt can sink a company. We can see that AMA Group Limited (ASX:AMA) does use debt in its business. But the more important question is: how much risk is that debt creating?
When Is Debt Dangerous?
Debt is a tool to help businesses grow, but if a business is incapable of paying off its lenders, then it exists at their mercy. Ultimately, if the company can't fulfill its legal obligations to repay debt, shareholders could walk away with nothing. While that is not too common, we often do see indebted companies permanently diluting shareholders because lenders force them to raise capital at a distressed price. By replacing dilution, though, debt can be an extremely good tool for businesses that need capital to invest in growth at high rates of return. The first step when considering a company's debt levels is to consider its cash and debt together.
Check out our latest analysis for AMA Group
What Is AMA Group's Net Debt?
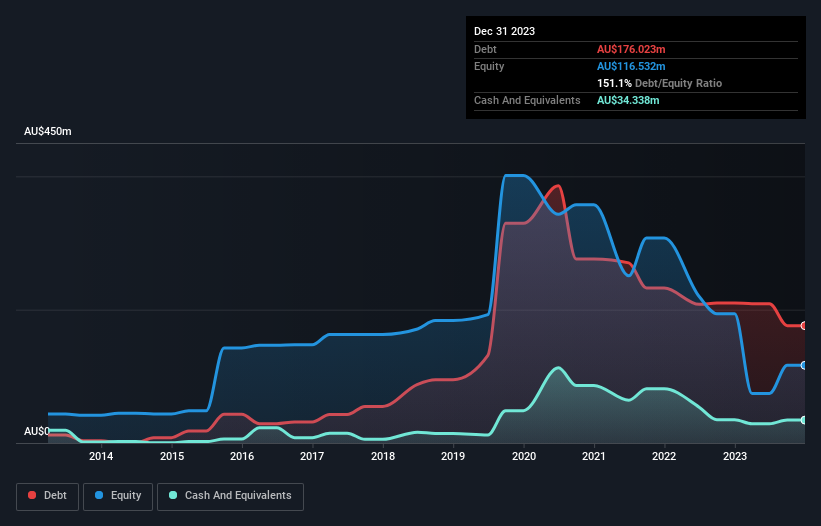
As you can see below, AMA Group had AU$176.0m of debt at December 2023, down from AU$210.0m a year prior. However, it does have AU$34.3m in cash offsetting this, leading to net debt of about AU$141.7m.
How Healthy Is AMA Group's Balance Sheet?
According to the last reported balance sheet, AMA Group had liabilities of AU$286.7m due within 12 months, and liabilities of AU$426.8m due beyond 12 months. On the other hand, it had cash of AU$34.3m and AU$55.8m worth of receivables due within a year. So its liabilities outweigh the sum of its cash and (near-term) receivables by AU$623.4m.
The deficiency here weighs heavily on the AU$104.8m company itself, as if a child were struggling under the weight of an enormous back-pack full of books, his sports gear, and a trumpet. So we'd watch its balance sheet closely, without a doubt. At the end of the day, AMA Group would probably need a major re-capitalization if its creditors were to demand repayment.
We measure a company's debt load relative to its earnings power by looking at its net debt divided by its earnings before interest, tax, depreciation, and amortization (EBITDA) and by calculating how easily its earnings before interest and tax (EBIT) cover its interest expense (interest cover). This way, we consider both the absolute quantum of the debt, as well as the interest rates paid on it.
Weak interest cover of 0.40 times and a disturbingly high net debt to EBITDA ratio of 7.1 hit our confidence in AMA Group like a one-two punch to the gut. The debt burden here is substantial. One redeeming factor for AMA Group is that it turned last year's EBIT loss into a gain of AU$16m, over the last twelve months. There's no doubt that we learn most about debt from the balance sheet. But ultimately the future profitability of the business will decide if AMA Group can strengthen its balance sheet over time. So if you're focused on the future you can check out this free report showing analyst profit forecasts.
But our final consideration is also important, because a company cannot pay debt with paper profits; it needs cold hard cash. So it is important to check how much of its earnings before interest and tax (EBIT) converts to actual free cash flow. Over the last year, AMA Group actually produced more free cash flow than EBIT. There's nothing better than incoming cash when it comes to staying in your lenders' good graces.
Our View
On the face of it, AMA Group's interest cover left us tentative about the stock, and its level of total liabilities was no more enticing than the one empty restaurant on the busiest night of the year. But on the bright side, its conversion of EBIT to free cash flow is a good sign, and makes us more optimistic. Overall, it seems to us that AMA Group's balance sheet is really quite a risk to the business. So we're almost as wary of this stock as a hungry kitten is about falling into its owner's fish pond: once bitten, twice shy, as they say. There's no doubt that we learn most about debt from the balance sheet. But ultimately, every company can contain risks that exist outside of the balance sheet. We've identified 2 warning signs with AMA Group (at least 1 which makes us a bit uncomfortable) , and understanding them should be part of your investment process.
If you're interested in investing in businesses that can grow profits without the burden of debt, then check out this free list of growing businesses that have net cash on the balance sheet.
If you're looking to trade AMA Group, open an account with the lowest-cost platform trusted by professionals, Interactive Brokers.
With clients in over 200 countries and territories, and access to 160 markets, IBKR lets you trade stocks, options, futures, forex, bonds and funds from a single integrated account.
Enjoy no hidden fees, no account minimums, and FX conversion rates as low as 0.03%, far better than what most brokers offer.
Sponsored ContentNew: Manage All Your Stock Portfolios in One Place
We've created the ultimate portfolio companion for stock investors, and it's free.
• Connect an unlimited number of Portfolios and see your total in one currency
• Be alerted to new Warning Signs or Risks via email or mobile
• Track the Fair Value of your stocks
Have feedback on this article? Concerned about the content? Get in touch with us directly. Alternatively, email editorial-team (at) simplywallst.com.
This article by Simply Wall St is general in nature. We provide commentary based on historical data and analyst forecasts only using an unbiased methodology and our articles are not intended to be financial advice. It does not constitute a recommendation to buy or sell any stock, and does not take account of your objectives, or your financial situation. We aim to bring you long-term focused analysis driven by fundamental data. Note that our analysis may not factor in the latest price-sensitive company announcements or qualitative material. Simply Wall St has no position in any stocks mentioned.
About ASX:AMA
AMA Group
Engages in the development and operation of collision repair business in Australia and New Zealand.
Very undervalued with adequate balance sheet.

