
Advertisement
XRF Scientific's (ASX:XRF) five-year earnings growth trails the 57% YoY shareholder returns
For many, the main point of investing in the stock market is to achieve spectacular returns. While the best companies are hard to find, but they can generate massive returns over long periods. For example, the XRF Scientific Limited (ASX:XRF) share price is up a whopping 684% in the last half decade, a handsome return for long term holders. If that doesn't get you thinking about long term investing, we don't know what will. It's also good to see the share price up 31% over the last quarter. It really delights us to see such great share price performance for investors.
After a strong gain in the past week, it's worth seeing if longer term returns have been driven by improving fundamentals.
Check out our latest analysis for XRF Scientific
While markets are a powerful pricing mechanism, share prices reflect investor sentiment, not just underlying business performance. One flawed but reasonable way to assess how sentiment around a company has changed is to compare the earnings per share (EPS) with the share price.
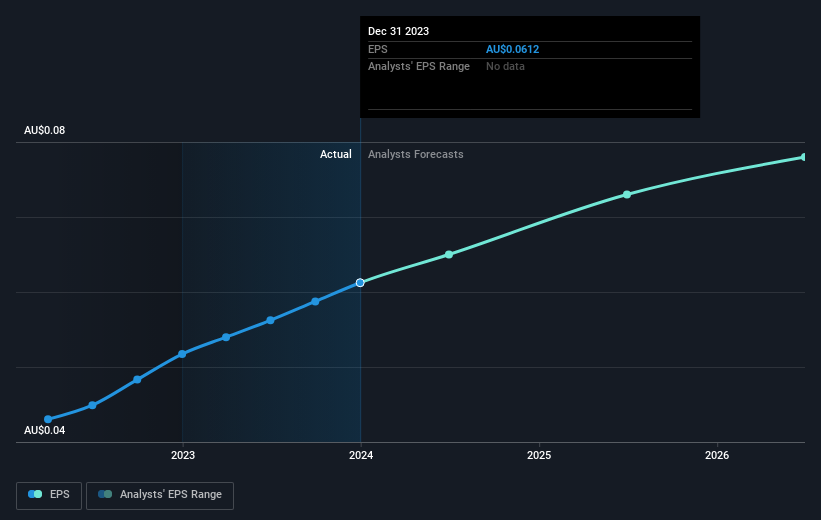
Over half a decade, XRF Scientific managed to grow its earnings per share at 39% a year. This EPS growth is lower than the 51% average annual increase in the share price. This suggests that market participants hold the company in higher regard, these days. And that's hardly shocking given the track record of growth.
The graphic below depicts how EPS has changed over time (unveil the exact values by clicking on the image).
We like that insiders have been buying shares in the last twelve months. Having said that, most people consider earnings and revenue growth trends to be a more meaningful guide to the business. It might be well worthwhile taking a look at our free report on XRF Scientific's earnings, revenue and cash flow.
What About Dividends?
As well as measuring the share price return, investors should also consider the total shareholder return (TSR). The TSR incorporates the value of any spin-offs or discounted capital raisings, along with any dividends, based on the assumption that the dividends are reinvested. So for companies that pay a generous dividend, the TSR is often a lot higher than the share price return. We note that for XRF Scientific the TSR over the last 5 years was 840%, which is better than the share price return mentioned above. The dividends paid by the company have thusly boosted the total shareholder return.
A Different Perspective
We're pleased to report that XRF Scientific shareholders have received a total shareholder return of 17% over one year. And that does include the dividend. However, that falls short of the 57% TSR per annum it has made for shareholders, each year, over five years. The pessimistic view would be that be that the stock has its best days behind it, but on the other hand the price might simply be moderating while the business itself continues to execute. Investors who like to make money usually check up on insider purchases, such as the price paid, and total amount bought. You can find out about the insider purchases of XRF Scientific by clicking this link.
There are plenty of other companies that have insiders buying up shares. You probably do not want to miss this free list of growing companies that insiders are buying.
Please note, the market returns quoted in this article reflect the market weighted average returns of stocks that currently trade on Australian exchanges.
New: AI Stock Screener & Alerts
Our new AI Stock Screener scans the market every day to uncover opportunities.
• Dividend Powerhouses (3%+ Yield)
• Undervalued Small Caps with Insider Buying
• High growth Tech and AI Companies
Or build your own from over 50 metrics.
Have feedback on this article? Concerned about the content? Get in touch with us directly. Alternatively, email editorial-team (at) simplywallst.com.
This article by Simply Wall St is general in nature. We provide commentary based on historical data and analyst forecasts only using an unbiased methodology and our articles are not intended to be financial advice. It does not constitute a recommendation to buy or sell any stock, and does not take account of your objectives, or your financial situation. We aim to bring you long-term focused analysis driven by fundamental data. Note that our analysis may not factor in the latest price-sensitive company announcements or qualitative material. Simply Wall St has no position in any stocks mentioned.
About ASX:XRF
XRF Scientific
Manufactures and markets precious metal products, specialized chemicals, and instruments for the scientific, analytical, construction material, and mining industries in Australia, Canada, and Europe.
Flawless balance sheet with proven track record.
Market Insights

Advertisement
Community Narratives
MicroVision will explode future revenue by 380.37% with a vision towards success
Fair Value US$60|98.4% undervalued
TH
Community Contributor
The Indispensable Artery for a New North American Economy
Fair Value CA$132.87|0.6% undervalued
TI
Community Contributor
Recently Updated Narratives
JO


JohnJ on Worldline ·
No miracle in sight
Fair Value:€7.0178.0% undervalued
8 followersusers have followed this narrative
0 commentsusers have commented on this narrative
0 likesusers have liked this narrative
MA


MarkoVT on COVER ·
Q3 Outlook modestly optimistic
Fair Value:JP¥1.65k2.0% overvalued
1 followerusers have followed this narrative
0 commentsusers have commented on this narrative
0 likesusers have liked this narrative
BL


BlackGoat on Alphabet ·
Alphabet: The Under-appreciated Compounder Hiding in Plain Sight
Fair Value:US$324.481.3% undervalued
80 followersusers have followed this narrative
3 commentsusers have commented on this narrative
1 likeusers have liked this narrative
Popular Narratives
OS

oscargarcia on Alphabet ·
The company that turned a verb into a global necessity and basically runs the modern internet, digital ads, smartphones, maps, and AI.
Fair Value:US$3405.9% undervalued
136 followersusers have followed this narrative
6 commentsusers have commented on this narrative
18 likesusers have liked this narrative
TH

TheWallstreetKing on MicroVision ·
MicroVision will explode future revenue by 380.37% with a vision towards success
Fair Value:US$6098.4% undervalued
90 followersusers have followed this narrative
10 commentsusers have commented on this narrative
18 likesusers have liked this narrative
AN


AnalystConsensusTarget on NVIDIA ·
NVDA: Expanding AI Demand Will Drive Major Data Center Investments Through 2026
Fair Value:US$232.7922.6% undervalued
928 followersusers have followed this narrative
6 commentsusers have commented on this narrative
22 likesusers have liked this narrative