
Advertisement
- Australia
- /
- Construction
- /
- ASX:JLG
Johns Lyng Group Limited's (ASX:JLG) Business Is Trailing The Market But Its Shares Aren't
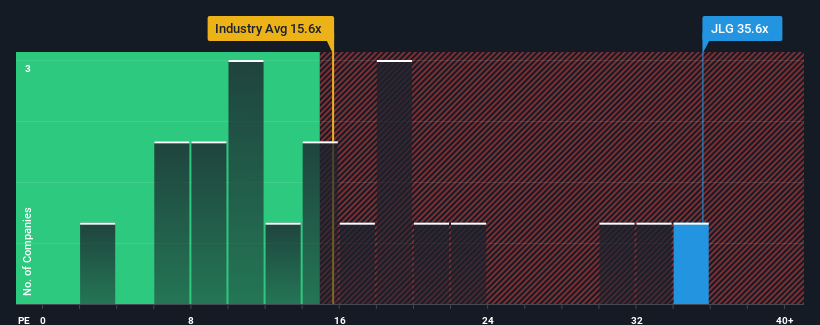
Johns Lyng Group Limited's (ASX:JLG) price-to-earnings (or "P/E") ratio of 35.6x might make it look like a strong sell right now compared to the market in Australia, where around half of the companies have P/E ratios below 19x and even P/E's below 11x are quite common. Nonetheless, we'd need to dig a little deeper to determine if there is a rational basis for the highly elevated P/E.
Recent times have been pleasing for Johns Lyng Group as its earnings have risen in spite of the market's earnings going into reverse. The P/E is probably high because investors think the company will continue to navigate the broader market headwinds better than most. You'd really hope so, otherwise you're paying a pretty hefty price for no particular reason.
See our latest analysis for Johns Lyng Group
Does Growth Match The High P/E?
The only time you'd be truly comfortable seeing a P/E as steep as Johns Lyng Group's is when the company's growth is on track to outshine the market decidedly.
Taking a look back first, we see that the company managed to grow earnings per share by a handy 13% last year. Pleasingly, EPS has also lifted 106% in aggregate from three years ago, partly thanks to the last 12 months of growth. Accordingly, shareholders would have probably welcomed those medium-term rates of earnings growth.
Turning to the outlook, the next three years should generate growth of 18% each year as estimated by the twelve analysts watching the company. That's shaping up to be similar to the 17% each year growth forecast for the broader market.
With this information, we find it interesting that Johns Lyng Group is trading at a high P/E compared to the market. Apparently many investors in the company are more bullish than analysts indicate and aren't willing to let go of their stock right now. These shareholders may be setting themselves up for disappointment if the P/E falls to levels more in line with the growth outlook.
The Final Word
While the price-to-earnings ratio shouldn't be the defining factor in whether you buy a stock or not, it's quite a capable barometer of earnings expectations.
We've established that Johns Lyng Group currently trades on a higher than expected P/E since its forecast growth is only in line with the wider market. When we see an average earnings outlook with market-like growth, we suspect the share price is at risk of declining, sending the high P/E lower. Unless these conditions improve, it's challenging to accept these prices as being reasonable.
Don't forget that there may be other risks. For instance, we've identified 2 warning signs for Johns Lyng Group that you should be aware of.
You might be able to find a better investment than Johns Lyng Group. If you want a selection of possible candidates, check out this free list of interesting companies that trade on a low P/E (but have proven they can grow earnings).
New: Manage All Your Stock Portfolios in One Place
We've created the ultimate portfolio companion for stock investors, and it's free.
• Connect an unlimited number of Portfolios and see your total in one currency
• Be alerted to new Warning Signs or Risks via email or mobile
• Track the Fair Value of your stocks
Have feedback on this article? Concerned about the content? Get in touch with us directly. Alternatively, email editorial-team (at) simplywallst.com.
This article by Simply Wall St is general in nature. We provide commentary based on historical data and analyst forecasts only using an unbiased methodology and our articles are not intended to be financial advice. It does not constitute a recommendation to buy or sell any stock, and does not take account of your objectives, or your financial situation. We aim to bring you long-term focused analysis driven by fundamental data. Note that our analysis may not factor in the latest price-sensitive company announcements or qualitative material. Simply Wall St has no position in any stocks mentioned.
About ASX:JLG
Johns Lyng Group
Provides integrated building services in Australia, New Zealand, and the United States.
Excellent balance sheet and slightly overvalued.
Similar Companies
Market Insights

Advertisement
Community Narratives
The company that turned a verb into a global necessity and basically runs the modern internet, digital ads, smartphones, maps, and AI.
Fair Value US$300.00|5.4% undervalued
OS
Community Contributor
Flowers Foods Pays A Fair Price For Health
Fair Value US$16.12|26.3% undervalued
NV
Community Contributor
TMX Group will thrive with 33.3% profit margin and enduring market moat
Fair Value CA$49.90|4.1% overvalued
LI
Community Contributor
The "Molecular Pencil": Why Beam's Technology is Built to Win
Fair Value US$65.01|62.7% undervalued
DA
Community Contributor