
Advertisement
Engenco (ASX:EGN) Has Rewarded Shareholders With An Exceptional 867% Total Return On Their Investment

We think all investors should try to buy and hold high quality multi-year winners. And highest quality companies can see their share prices grow by huge amounts. For example, the Engenco Limited (ASX:EGN) share price is up a whopping 771% in the last half decade, a handsome return for long term holders. If that doesn't get you thinking about long term investing, we don't know what will. It's also good to see the share price up 17% over the last quarter. But this could be related to the strong market, which is up 15% in the last three months.
Anyone who held for that rewarding ride would probably be keen to talk about it.
See our latest analysis for Engenco
In his essay The Superinvestors of Graham-and-Doddsville Warren Buffett described how share prices do not always rationally reflect the value of a business. By comparing earnings per share (EPS) and share price changes over time, we can get a feel for how investor attitudes to a company have morphed over time.
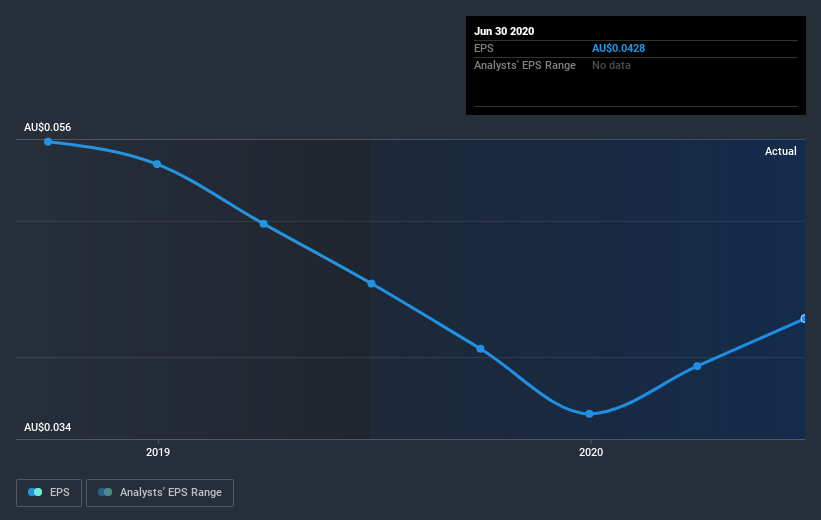
During the last half decade, Engenco became profitable. That kind of transition can be an inflection point that justifies a strong share price gain, just as we have seen here. Given that the company made a profit three years ago, but not five years ago, it is worth looking at the share price returns over the last three years, too. Indeed, the Engenco share price has gained 9.9% in three years. Meanwhile, EPS is up 16% per year. This EPS growth is higher than the 3.2% average annual increase in the share price over the same three years. Therefore, it seems the market has moderated its expectations for growth, somewhat.
The company's earnings per share (over time) is depicted in the image below (click to see the exact numbers).
It might be well worthwhile taking a look at our free report on Engenco's earnings, revenue and cash flow.
What About Dividends?
As well as measuring the share price return, investors should also consider the total shareholder return (TSR). The TSR is a return calculation that accounts for the value of cash dividends (assuming that any dividend received was reinvested) and the calculated value of any discounted capital raisings and spin-offs. So for companies that pay a generous dividend, the TSR is often a lot higher than the share price return. In the case of Engenco, it has a TSR of 867% for the last 5 years. That exceeds its share price return that we previously mentioned. The dividends paid by the company have thusly boosted the total shareholder return.
A Different Perspective
We're pleased to report that Engenco shareholders have received a total shareholder return of 13% over one year. Of course, that includes the dividend. However, the TSR over five years, coming in at 57% per year, is even more impressive. The pessimistic view would be that be that the stock has its best days behind it, but on the other hand the price might simply be moderating while the business itself continues to execute. I find it very interesting to look at share price over the long term as a proxy for business performance. But to truly gain insight, we need to consider other information, too. For instance, we've identified 1 warning sign for Engenco that you should be aware of.
For those who like to find winning investments this free list of growing companies with recent insider purchasing, could be just the ticket.
Please note, the market returns quoted in this article reflect the market weighted average returns of stocks that currently trade on AU exchanges.
If you decide to trade Engenco, use the lowest-cost* platform that is rated #1 Overall by Barron’s, Interactive Brokers. Trade stocks, options, futures, forex, bonds and funds on 135 markets, all from a single integrated account. Promoted
Valuation is complex, but we're here to simplify it.
Discover if Engenco might be undervalued or overvalued with our detailed analysis, featuring fair value estimates, potential risks, dividends, insider trades, and its financial condition.
Access Free AnalysisThis article by Simply Wall St is general in nature. It does not constitute a recommendation to buy or sell any stock, and does not take account of your objectives, or your financial situation. We aim to bring you long-term focused analysis driven by fundamental data. Note that our analysis may not factor in the latest price-sensitive company announcements or qualitative material. Simply Wall St has no position in any stocks mentioned.
*Interactive Brokers Rated Lowest Cost Broker by StockBrokers.com Annual Online Review 2020
Have feedback on this article? Concerned about the content? Get in touch with us directly. Alternatively, email editorial-team (at) simplywallst.com.
About ASX:EGN
Excellent balance sheet moderate.
Similar Companies
Market Insights

Advertisement
Community Narratives
WhiteCap Is Positioned To Profit Regardless Of Trump's Policy 
Fair Value CA$22.60|61.6% undervalued
ST
Equity Analyst and Writer
Microsoft's Evolution Will Drive Revenue to New Heights Fueled by AI
Fair Value US$360.00|28.3% overvalued
BR
Community Contributor
A CASE FOR USD$2.50 (CAD$3.44) BY 2028 (A 5-10 BAGGER)
Fair Value CA$3.44|87.8% undervalued
AG
Community Contributor