- Australia
- /
- Construction
- /
- ASX:AE1
There Are Reasons To Feel Uneasy About Aerison Group's (ASX:AE1) Returns On Capital


If you're looking for a multi-bagger, there's a few things to keep an eye out for. Ideally, a business will show two trends; firstly a growing return on capital employed (ROCE) and secondly, an increasing amount of capital employed. This shows us that it's a compounding machine, able to continually reinvest its earnings back into the business and generate higher returns. So when we looked at Aerison Group (ASX:AE1), they do have a high ROCE, but we weren't exactly elated from how returns are trending.
Return On Capital Employed (ROCE): What Is It?
For those that aren't sure what ROCE is, it measures the amount of pre-tax profits a company can generate from the capital employed in its business. Analysts use this formula to calculate it for Aerison Group:
Return on Capital Employed = Earnings Before Interest and Tax (EBIT) ÷ (Total Assets - Current Liabilities)
0.24 = AU$9.1m ÷ (AU$85m - AU$47m) (Based on the trailing twelve months to December 2021).
So, Aerison Group has an ROCE of 24%. In absolute terms that's a great return and it's even better than the Construction industry average of 14%.
See our latest analysis for Aerison Group
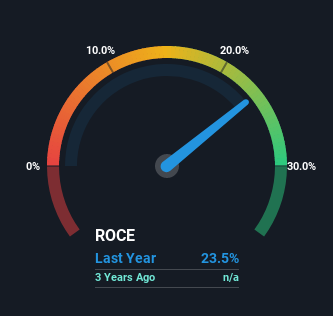
Historical performance is a great place to start when researching a stock so above you can see the gauge for Aerison Group's ROCE against it's prior returns. If you want to delve into the historical earnings, revenue and cash flow of Aerison Group, check out these free graphs here.
So How Is Aerison Group's ROCE Trending?
On the surface, the trend of ROCE at Aerison Group doesn't inspire confidence. Historically returns on capital were even higher at 53%, but they have dropped over the last two years. Although, given both revenue and the amount of assets employed in the business have increased, it could suggest the company is investing in growth, and the extra capital has led to a short-term reduction in ROCE. And if the increased capital generates additional returns, the business, and thus shareholders, will benefit in the long run.
On a related note, Aerison Group has decreased its current liabilities to 55% of total assets. That could partly explain why the ROCE has dropped. What's more, this can reduce some aspects of risk to the business because now the company's suppliers or short-term creditors are funding less of its operations. Since the business is basically funding more of its operations with it's own money, you could argue this has made the business less efficient at generating ROCE. Either way, they're still at a pretty high level, so we'd like to see them fall further if possible.
The Bottom Line
Even though returns on capital have fallen in the short term, we find it promising that revenue and capital employed have both increased for Aerison Group. And there could be an opportunity here if other metrics look good too, because the stock has declined 33% in the last year. As a result, we'd recommend researching this stock further to uncover what other fundamentals of the business can show us.
One final note, you should learn about the 3 warning signs we've spotted with Aerison Group (including 1 which is potentially serious) .
If you'd like to see other companies earning high returns, check out our free list of companies earning high returns with solid balance sheets here.
New: Manage All Your Stock Portfolios in One Place
We've created the ultimate portfolio companion for stock investors, and it's free.
• Connect an unlimited number of Portfolios and see your total in one currency
• Be alerted to new Warning Signs or Risks via email or mobile
• Track the Fair Value of your stocks
Have feedback on this article? Concerned about the content? Get in touch with us directly. Alternatively, email editorial-team (at) simplywallst.com.
This article by Simply Wall St is general in nature. We provide commentary based on historical data and analyst forecasts only using an unbiased methodology and our articles are not intended to be financial advice. It does not constitute a recommendation to buy or sell any stock, and does not take account of your objectives, or your financial situation. We aim to bring you long-term focused analysis driven by fundamental data. Note that our analysis may not factor in the latest price-sensitive company announcements or qualitative material. Simply Wall St has no position in any stocks mentioned.
About ASX:AE1
Aerison Group
Aerison Group Limited operates as an engineering, design, and construction company in Australia.
Good value with mediocre balance sheet.
Market Insights

Community Narratives


