- Austria
- /
- Commercial Services
- /
- WBAG:DOC
DO & CO Aktiengesellschaft's (VIE:DOC) Stock Has Been Sliding But Fundamentals Look Strong: Is The Market Wrong?


It is hard to get excited after looking at DO & CO's (VIE:DOC) recent performance, when its stock has declined 11% over the past three months. However, stock prices are usually driven by a company’s financial performance over the long term, which in this case looks quite promising. Specifically, we decided to study DO & CO's ROE in this article.
Return on equity or ROE is an important factor to be considered by a shareholder because it tells them how effectively their capital is being reinvested. Put another way, it reveals the company's success at turning shareholder investments into profits.
See our latest analysis for DO & CO
How Is ROE Calculated?
ROE can be calculated by using the formula:
Return on Equity = Net Profit (from continuing operations) ÷ Shareholders' Equity
So, based on the above formula, the ROE for DO & CO is:
23% = €80m ÷ €354m (Based on the trailing twelve months to June 2024).
The 'return' is the amount earned after tax over the last twelve months. So, this means that for every €1 of its shareholder's investments, the company generates a profit of €0.23.
Why Is ROE Important For Earnings Growth?
Thus far, we have learned that ROE measures how efficiently a company is generating its profits. Depending on how much of these profits the company reinvests or "retains", and how effectively it does so, we are then able to assess a company’s earnings growth potential. Assuming all else is equal, companies that have both a higher return on equity and higher profit retention are usually the ones that have a higher growth rate when compared to companies that don't have the same features.
A Side By Side comparison of DO & CO's Earnings Growth And 23% ROE
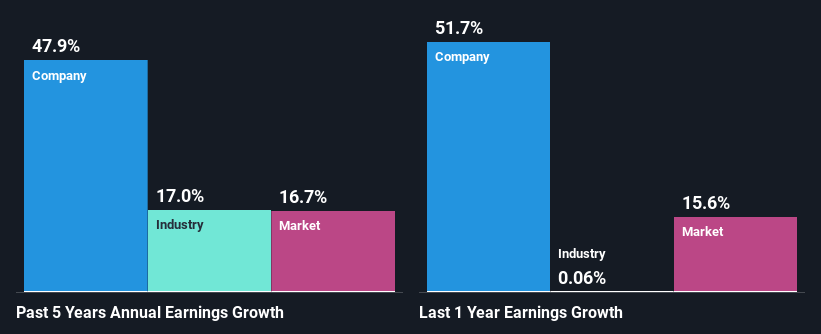
To begin with, DO & CO has a pretty high ROE which is interesting. Additionally, the company's ROE is higher compared to the industry average of 12% which is quite remarkable. As a result, DO & CO's exceptional 48% net income growth seen over the past five years, doesn't come as a surprise.
As a next step, we compared DO & CO's net income growth with the industry, and pleasingly, we found that the growth seen by the company is higher than the average industry growth of 17%.
Earnings growth is a huge factor in stock valuation. It’s important for an investor to know whether the market has priced in the company's expected earnings growth (or decline). This then helps them determine if the stock is placed for a bright or bleak future. One good indicator of expected earnings growth is the P/E ratio which determines the price the market is willing to pay for a stock based on its earnings prospects. So, you may want to check if DO & CO is trading on a high P/E or a low P/E, relative to its industry.
Is DO & CO Using Its Retained Earnings Effectively?
DO & CO's ' three-year median payout ratio is on the lower side at 22% implying that it is retaining a higher percentage (78%) of its profits. So it looks like DO & CO is reinvesting profits heavily to grow its business, which shows in its earnings growth.
Besides, DO & CO has been paying dividends for at least ten years or more. This shows that the company is committed to sharing profits with its shareholders. Our latest analyst data shows that the future payout ratio of the company over the next three years is expected to be approximately 25%. As a result, DO & CO's ROE is not expected to change by much either, which we inferred from the analyst estimate of 26% for future ROE.
Summary
Overall, we are quite pleased with DO & CO's performance. In particular, it's great to see that the company is investing heavily into its business and along with a high rate of return, that has resulted in a sizeable growth in its earnings. Having said that, the company's earnings growth is expected to slow down, as forecasted in the current analyst estimates. Are these analysts expectations based on the broad expectations for the industry, or on the company's fundamentals? Click here to be taken to our analyst's forecasts page for the company.
New: Manage All Your Stock Portfolios in One Place
We've created the ultimate portfolio companion for stock investors, and it's free.
• Connect an unlimited number of Portfolios and see your total in one currency
• Be alerted to new Warning Signs or Risks via email or mobile
• Track the Fair Value of your stocks
Have feedback on this article? Concerned about the content? Get in touch with us directly. Alternatively, email editorial-team (at) simplywallst.com.
This article by Simply Wall St is general in nature. We provide commentary based on historical data and analyst forecasts only using an unbiased methodology and our articles are not intended to be financial advice. It does not constitute a recommendation to buy or sell any stock, and does not take account of your objectives, or your financial situation. We aim to bring you long-term focused analysis driven by fundamental data. Note that our analysis may not factor in the latest price-sensitive company announcements or qualitative material. Simply Wall St has no position in any stocks mentioned.
About WBAG:DOC
DO & CO
Provides catering services in Austria, Turkey, Great Britain, the United States, Spain, Germany, and internationally.
Flawless balance sheet with solid track record.

