
Advertisement
- Austria
- /
- Basic Materials
- /
- WBAG:WIE
Declining Stock and Decent Financials: Is The Market Wrong About Wienerberger AG (VIE:WIE)?
It is hard to get excited after looking at Wienerberger's (VIE:WIE) recent performance, when its stock has declined 13% over the past three months. However, stock prices are usually driven by a company’s financials over the long term, which in this case look pretty respectable. In this article, we decided to focus on Wienerberger's ROE.
Return on equity or ROE is a key measure used to assess how efficiently a company's management is utilizing the company's capital. In simpler terms, it measures the profitability of a company in relation to shareholder's equity.
Check out our latest analysis for Wienerberger
How Is ROE Calculated?
ROE can be calculated by using the formula:
Return on Equity = Net Profit (from continuing operations) ÷ Shareholders' Equity
So, based on the above formula, the ROE for Wienerberger is:
2.5% = €71m ÷ €2.8b (Based on the trailing twelve months to September 2024).
The 'return' refers to a company's earnings over the last year. That means that for every €1 worth of shareholders' equity, the company generated €0.03 in profit.
What Has ROE Got To Do With Earnings Growth?
So far, we've learned that ROE is a measure of a company's profitability. We now need to evaluate how much profit the company reinvests or "retains" for future growth which then gives us an idea about the growth potential of the company. Assuming all else is equal, companies that have both a higher return on equity and higher profit retention are usually the ones that have a higher growth rate when compared to companies that don't have the same features.
Wienerberger's Earnings Growth And 2.5% ROE
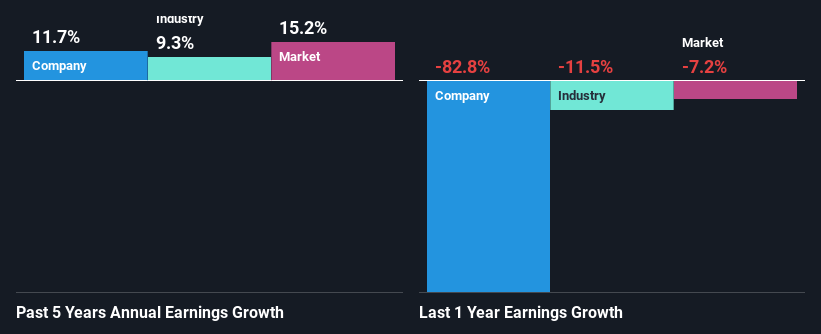
As you can see, Wienerberger's ROE looks pretty weak. Even when compared to the industry average of 9.2%, the ROE figure is pretty disappointing. Although, we can see that Wienerberger saw a modest net income growth of 12% over the past five years. We believe that there might be other aspects that are positively influencing the company's earnings growth. For example, it is possible that the company's management has made some good strategic decisions, or that the company has a low payout ratio.
We then compared Wienerberger's net income growth with the industry and we're pleased to see that the company's growth figure is higher when compared with the industry which has a growth rate of 9.3% in the same 5-year period.
Earnings growth is an important metric to consider when valuing a stock. What investors need to determine next is if the expected earnings growth, or the lack of it, is already built into the share price. By doing so, they will have an idea if the stock is headed into clear blue waters or if swampy waters await. If you're wondering about Wienerberger's's valuation, check out this gauge of its price-to-earnings ratio, as compared to its industry.
Is Wienerberger Using Its Retained Earnings Effectively?
In Wienerberger's case, its respectable earnings growth can probably be explained by its low three-year median payout ratio of 24% (or a retention ratio of 76%), which suggests that the company is investing most of its profits to grow its business.
Moreover, Wienerberger is determined to keep sharing its profits with shareholders which we infer from its long history of paying a dividend for at least ten years. Our latest analyst data shows that the future payout ratio of the company is expected to rise to 30% over the next three years. However, Wienerberger's future ROE is expected to rise to 12% despite the expected increase in the company's payout ratio. We infer that there could be other factors that could be driving the anticipated growth in the company's ROE.
Conclusion
On the whole, we do feel that Wienerberger has some positive attributes. With a high rate of reinvestment, albeit at a low ROE, the company has managed to see a considerable growth in its earnings. Having said that, looking at the current analyst estimates, we found that the company's earnings are expected to gain momentum. To know more about the company's future earnings growth forecasts take a look at this free report on analyst forecasts for the company to find out more.
Valuation is complex, but we're here to simplify it.
Discover if Wienerberger might be undervalued or overvalued with our detailed analysis, featuring fair value estimates, potential risks, dividends, insider trades, and its financial condition.
Access Free AnalysisHave feedback on this article? Concerned about the content? Get in touch with us directly. Alternatively, email editorial-team (at) simplywallst.com.
This article by Simply Wall St is general in nature. We provide commentary based on historical data and analyst forecasts only using an unbiased methodology and our articles are not intended to be financial advice. It does not constitute a recommendation to buy or sell any stock, and does not take account of your objectives, or your financial situation. We aim to bring you long-term focused analysis driven by fundamental data. Note that our analysis may not factor in the latest price-sensitive company announcements or qualitative material. Simply Wall St has no position in any stocks mentioned.
About WBAG:WIE
Wienerberger
Produces and sells clay blocks, facing bricks, roof tiles, and pavers in Europe West, Europe East, and North America.
Undervalued established dividend payer.
Similar Companies
Market Insights

Advertisement
Community Narratives
The "Molecular Pencil": Why Beam's Technology is Built to Win
Fair Value US$65.01|65.8% undervalued
DA
Community Contributor
The silent giant behind virtually every advanced chip powering AI, smartphones, and modern infrastructure.
Fair Value US$310.00|7.6% undervalued
OS
Community Contributor
ADP Stock: Solid Fundamentals, But AI Investments Test Its Margin Resilience
Fair Value US$387.77|34.5% undervalued
YI
Community Contributor