

The simplest way to invest in stocks is to buy exchange traded funds. But one can do better than that by picking better than average stocks (as part of a diversified portfolio). For example, the Palfinger AG (VIE:PAL) share price is up 46% in the last year, clearly besting the market return of around 14% (not including dividends). That's a solid performance by our standards! However, the stock hasn't done so well in the longer term, with the stock only up 1.2% in three years.
View our latest analysis for Palfinger
In his essay The Superinvestors of Graham-and-Doddsville Warren Buffett described how share prices do not always rationally reflect the value of a business. One way to examine how market sentiment has changed over time is to look at the interaction between a company's share price and its earnings per share (EPS).
During the last year, Palfinger actually saw its earnings per share drop 38%.
This means it's unlikely the market is judging the company based on earnings growth. Therefore, it seems likely that investors are putting more weight on metrics other than EPS, at the moment.
We are skeptical of the suggestion that the 1.4% dividend yield would entice buyers to the stock. Palfinger's revenue actually dropped 13% over last year. So the fundamental metrics don't provide an obvious explanation for the share price gain.
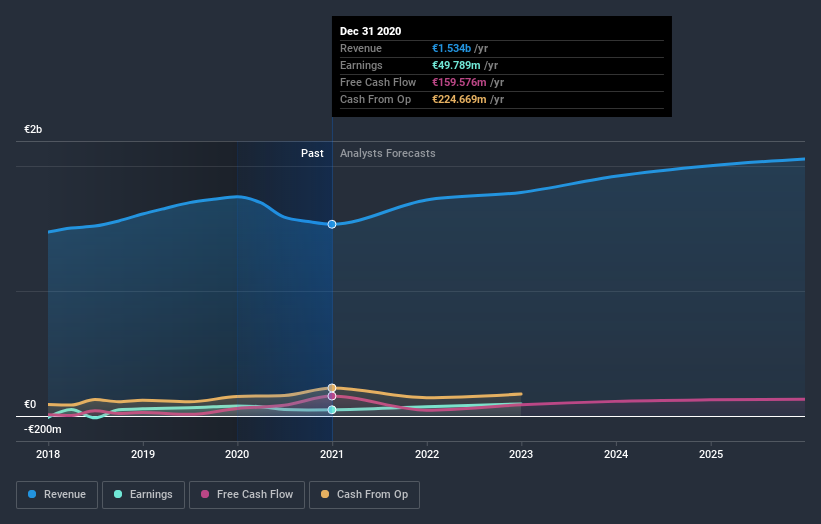
You can see how earnings and revenue have changed over time in the image below (click on the chart to see the exact values).
It is of course excellent to see how Palfinger has grown profits over the years, but the future is more important for shareholders. It might be well worthwhile taking a look at our free report on how its financial position has changed over time.
What About Dividends?
As well as measuring the share price return, investors should also consider the total shareholder return (TSR). Whereas the share price return only reflects the change in the share price, the TSR includes the value of dividends (assuming they were reinvested) and the benefit of any discounted capital raising or spin-off. Arguably, the TSR gives a more comprehensive picture of the return generated by a stock. As it happens, Palfinger's TSR for the last year was 48%, which exceeds the share price return mentioned earlier. The dividends paid by the company have thusly boosted the total shareholder return.
A Different Perspective
It's nice to see that Palfinger shareholders have received a total shareholder return of 48% over the last year. That's including the dividend. That gain is better than the annual TSR over five years, which is 8%. Therefore it seems like sentiment around the company has been positive lately. Given the share price momentum remains strong, it might be worth taking a closer look at the stock, lest you miss an opportunity. I find it very interesting to look at share price over the long term as a proxy for business performance. But to truly gain insight, we need to consider other information, too. For example, we've discovered 3 warning signs for Palfinger that you should be aware of before investing here.
Of course, you might find a fantastic investment by looking elsewhere. So take a peek at this free list of companies we expect will grow earnings.
Please note, the market returns quoted in this article reflect the market weighted average returns of stocks that currently trade on AT exchanges.
If you’re looking to trade Palfinger, open an account with the lowest-cost* platform trusted by professionals, Interactive Brokers. Their clients from over 200 countries and territories trade stocks, options, futures, forex, bonds and funds worldwide from a single integrated account. Promoted
New: Manage All Your Stock Portfolios in One Place
We've created the ultimate portfolio companion for stock investors, and it's free.
• Connect an unlimited number of Portfolios and see your total in one currency
• Be alerted to new Warning Signs or Risks via email or mobile
• Track the Fair Value of your stocks
This article by Simply Wall St is general in nature. It does not constitute a recommendation to buy or sell any stock, and does not take account of your objectives, or your financial situation. We aim to bring you long-term focused analysis driven by fundamental data. Note that our analysis may not factor in the latest price-sensitive company announcements or qualitative material. Simply Wall St has no position in any stocks mentioned.
*Interactive Brokers Rated Lowest Cost Broker by StockBrokers.com Annual Online Review 2020
Have feedback on this article? Concerned about the content? Get in touch with us directly. Alternatively, email editorial-team (at) simplywallst.com.
About WBAG:PAL
Undervalued with adequate balance sheet.
Similar Companies
Market Insights

Community Narratives

